Rockerbox is leveraging its unique dataset of digitally native companies to help you better understand the impact of COVID-19 on ad spend. For an in-depth look at revenue by vertical, check out our daily DTC revenue tracker.
How is spend changing?
To understand how spend is changing, we started by looking at how Rockerbox brands have adjusted spend. We used a pre-COVID-19 time period as a baseline and calculated the change in spend during the average week in each temporal period (pre-COVID versus post-COVID).
Below is the distribution describing the changes that have taken place during this time period.
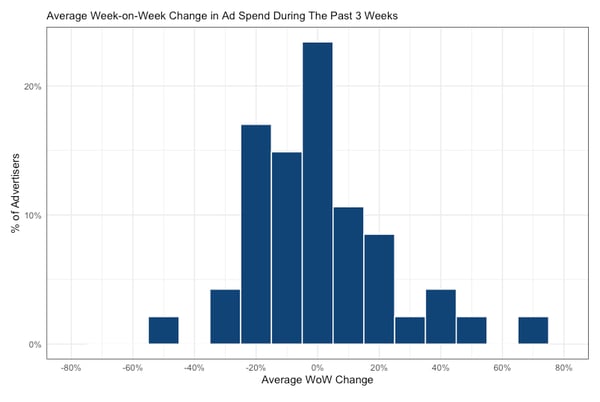
From the distribution above, we can see that two-thirds of advertisers have responded to COVID-19 with caution. They have either decreased their weekly ad spend or kept it steady during this time period. Still, approximately one-third of advertisers have increased their investment in marketing, by either restoring their ad spend back to its baseline or capitalizing on COVID-19 trends that are favorable to their businesses.
Why are advertisers adjusting budgets?
The macroeconomic impact of COVID-19 cannot be overstated as the main driver for ad spend reductions. Businesses are trying to maintain profitability through uncertain times. Since COVID-19 has had a significant impact on consumer behavior (and consumer spending), we expect ad spend decisions to be highly correlated with changes in revenue.
In this analysis, we have decided to look at revenue changes versus spend changes to fully understand:
- How advertisers are adjusting ad spend
- The magnitude in their ad spend changes
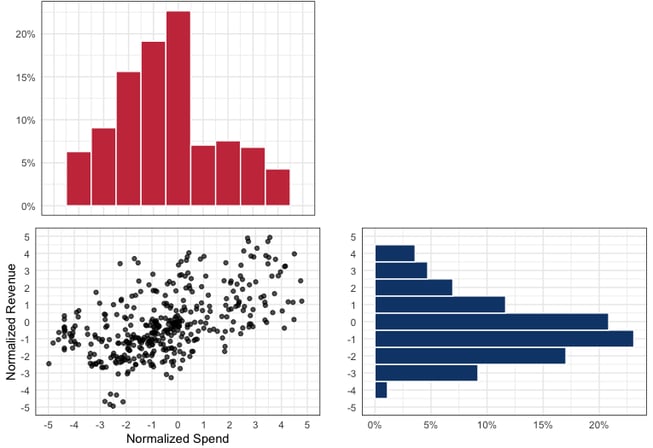
To perform the analysis, we created standardized figures for revenue and spend respectively. This transformation has two main advantages:
- It allows us to easily compare companies of different sizes
- It accounts for the natural differences in revenue variation between companies
The graph below shows the distribution of normalized spend (top left, red) and revenue (bottom right, blue), as well as their relationship (bottom left) in the past 10 days versus the normalized baseline.
The changes companies have made in response to COVID-19 and the resulting market conditions have clearly been varied and clearly correlated with spend.
Consumer behavior (and the resulting purchases they make) is largely outside of the control of individual companies. It's important to understand the scope and change in how this behavior has changed. Specifically, to summarize the above revenue distribution:
- 30% of companies have seen a statistically significant drop in revenue
- 44% of companies have been revenue neutral
- 27% of companies have seen a statistically significant increase in revenue
As shown in our daily analysis, these shifts in revenue are very vertical dependent and help to explain why there is a distribution of outcomes. See here for more details on how we have seen revenue shift.
Unlike revenue, marketing spend is directly controlled by the brands.
Marketers have control over how they respond to revenue changes and the specific adjustments they make to the marketing budget. What we are most interested in investigating is how spend changes relative to the change in revenue. Our expectation would be for an advertiser to adjust spend proportionally to revenue.
Since we are using standardized metrics that have normalized both spend and revenue to each advertisers baseline, an easy way to uncover the relationship between standardized spend and revenue is to take their difference.
For example, when an advertiser:
- Cuts spend more than revenue, the metric will produce a negative number.
- Cuts spend less than revenue, the metric will produce a positive number.
Below we have plotted the difference between normalized revenue versus normalized spend. The left-hand side of the distribution shows the percentage of advertisers that have decreased spend more than revenue while the right hand side shows spend that is higher than the fluctuation in revenue.
(Another way of interpreting this statistically is to make the assumption that the ideal change between revenue and spend would be one of direct correlation, i.e, y = x. In this scenario, we are inspecting the residuals or how far away each point falls from that line and plotting them.)

The above distribution is skewed towards the left, implying that the relative reduction in spend has been greater that the reduction in revenue. However, this is not exclusively true, and in fact, advertisers have produced a range of responses to changes in revenue.
- Some have cut spend more than revenue (~40%)
- Some have balanced cuts to spend proportionately to revenue (~35%)
- Some have maintained a higher spend ratio relative to revenue (~25%)
From a marketing perspective, companies that cut spend more than revenue should expect their CPA and ROAS to improve whereas companies that have maintained a higher spend ratio relative to revenue should expect their CPA and ROAS to become less efficient.
Below we are going to break down the three scenarios and reactions brands have had to COVID-19 to better understand what data is used to make decisions and infer why these changes to advertising spend are happening.
Impact analysis: Companies that cut spend more than revenue
Digging deeper into companies that cut spend proportionately more than revenue, we want to better understand the actions that are being taken resulting in cases where spend is cut more than revenue.
Specifically, we want to better understand:
- If revenue is dropping because of a spend reduction
- If revenue is flat while spend is reduced
The plot below shows examples (pulled from the bottom 15% of the distribution) of companies who have cut spend relatively more than revenue:
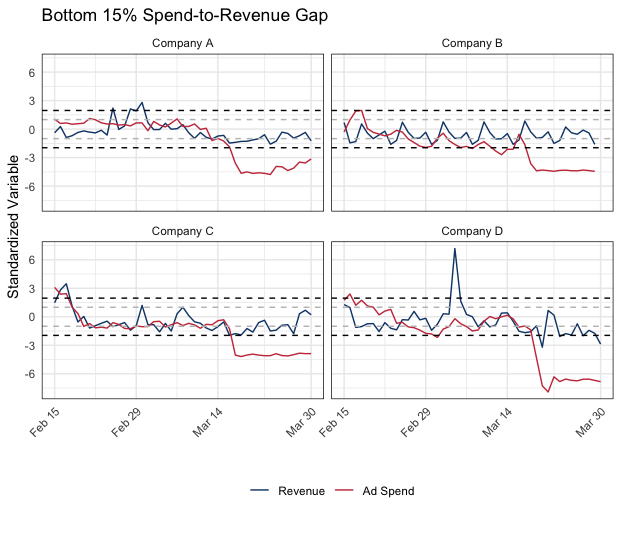
All four of these companies drastically cut their ad spend during the week of March 15th. With the exception of company C, which seems to currently be experiencing a rebound in revenue, those companies’ revenue has since then been stagnant.
Looking objectively at just these metrics:
- Companies A and D both have warranted the spend reduction as their revenue fell before cutting spend. Also, revenue has appeared to have reached a "floor" implying that they are only spending on their most efficient marketing.
- Companies B and C in contrast appear to have not seen a significant reduction in revenue but have cut spend early. They likely cut inefficient spend from their marketing mix as well, but will likely see future revenue generation suffer going forward.
Companies B and C may have overreacted or predicted revenue would fall further than it actually has whereas A and D likely made the correct decision to cut back on their marketing spend swiftly.
Impact analysis: Companies that have proportionally scaled back spend as revenue has declined
We now turn to the median of our distribution: companies which had changes in spend proportional to their changes in revenue.
This proportionality could be the result of three different trends:
- Revenue and spend increasing at the same speed
- Flat revenue with no changes in spend
- Revenue and spend decreasing at the same speed
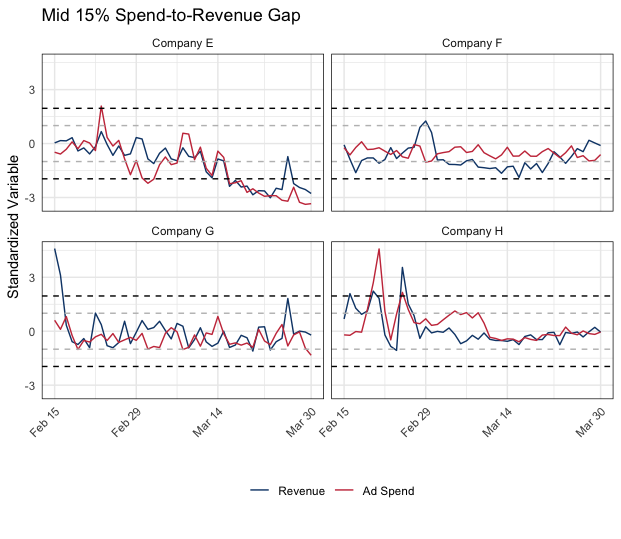
From our sample above, two of those trends are present: companies F, H, and G have had fairly level revenues and ad spends throughout March, while company E has adjusted their spending to match their downwards and upwards trend in revenues perfectly.
This seems to have allowed all but company E to return to the baseline revenue they were accustomed to in February.
The changes experienced by this median group which responded proportionally has enabled them to make gradual spend adjustments and quickly get back to baseline revenue.
Impact analysis: Companies that have increased their spend to revenue ratio
We finally take a look at companies where spend is outpacing revenue. Companies with a high spend-to-revenue difference may have either:
- Increased spending by more than their increase in revenue
- Kept their spend level despite a decrease in revenue
We would expect companies which have increased spend relative to revenue to have had a smaller decrease in revenue than those who did not (though this is likely also influenced by their vertical’s position during a downturn such as this).
Companies which have maintained spend despite revenue loss should have a less gradual decrease in revenue than companies which cut it drastically.
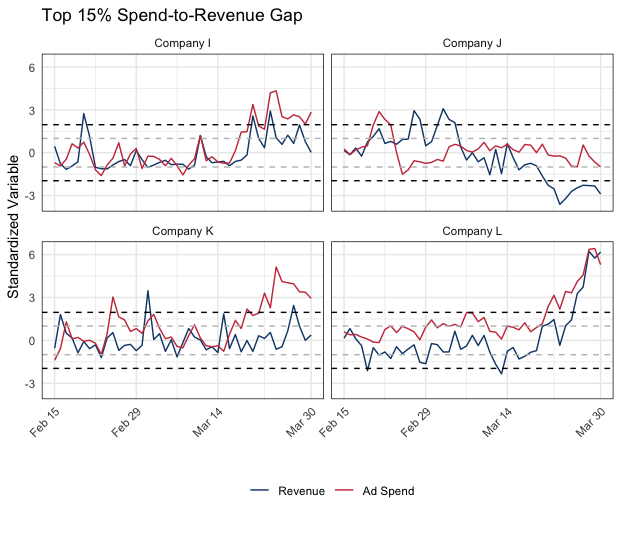
Companies I and K both increased their ad spend as revenue accelerated. As a result, company I had a clear and sharp increase in revenue, while company K’s revenue kept at around its baseline, with no noticeable ‘COVID’ dip.
Company L kept its spend above the baseline throughout February and March 2020. In mid-March, they increased their ad spend and their revenue increased correspondingly, leading to well-above average revenue by the end of March.
Company J kept its spend level despite a decrease in revenue due to COVID-19. This strategy seems to have yielded a weak late-March rebound, which remains unfortunately 2 standard deviations below from their baseline.
We anticipate that companies I, L, and K will have strong performance in their business and on their marketing while they deal with COVID-19.
In comparison, we believe that Company J should be acting more quickly to proportionally match marketing spend to revenue.
Conclusion / Takeaways
The most common response DTC advertisers have taken to declining revenue has been to cut spend proportionally more than the decrease in revenue.
40% of the advertisers tracked have taken this approach, likely keeping only the most efficient marketing in the mix.
Although the actions of these companies may look dramatic, they have likely made the correct business decision for their business in the short-run — increasing margins by paying less per acquired customer.
44% of DTC advertisers have been able to balance marketing budget cuts proportionally with revenue or have not seen revenue significantly decline and have kept marketing spend constant.
We believe that the companies that have been able to take a measured approach to marketing and have scaled their marketing budgets to match revenue are best positioned to recover quickly and capitalize on marketing opportunities that will drive meaningful revenue growth.
27% of DTC advertisers have increased their marketing spend ratio during this time. The two scenarios that are producing this result are advertisers who have chosen to either:
- Not cut spend in the face of declining revenue
- Increase marketing spend while revenue has risen
The last bucket has two very different company types in it so we will address these independently:
- Companies that have not significantly decreased spend but are facing declining revenues should be making efforts to preserve cash and stabilize ROAS. They should be able to take a measured to cutting spend and keep their most efficient strategies alive
- Companies that are seeing a revenue surge should take advantage of the advertising marketing and invest heavily. Market conditions have softened, CPMs are lower and will likely see a strong ROI.
Overall, we believe marketers have acted rationally in response to very quickly changing market conditions. Even more specifically, we believe that the advertisers who have taken the most measured approach to cutting budget will have the most success over the long run as they have been able to nimbly navigate and invest in marketing relative to revenue.
For daily updates on revenue by vertical,
check out our Daily DTC Revenue Tracker.
 Google
 Facebook
 Instagram
 TikTok
 Snapchat
 Reddit
 Pinterest

.png?width=50&height=56&name=medal%20(1).png)


-Jul-01-2025-10-07-00-0906-PM.png?width=435&height=200&name=Blog%20Headers%20-%20New%20(1200%20%C3%97%20800%20px)-Jul-01-2025-10-07-00-0906-PM.png)
%20(1)-Aug-27-2024-08-16-34-4978-PM.png?width=435&height=200&name=Blog%20Headers%20-%20New%20(1200%20%C3%97%20800%20px)%20(1)-Aug-27-2024-08-16-34-4978-PM.png)