Google
 Facebook
 Instagram
 TikTok
 Snapchat
 Reddit
 Pinterest


.png?width=50&height=56&name=medal%20(1).png)


Rockerbox Unifies Your
M
Validate, Calibrate, and Optimize
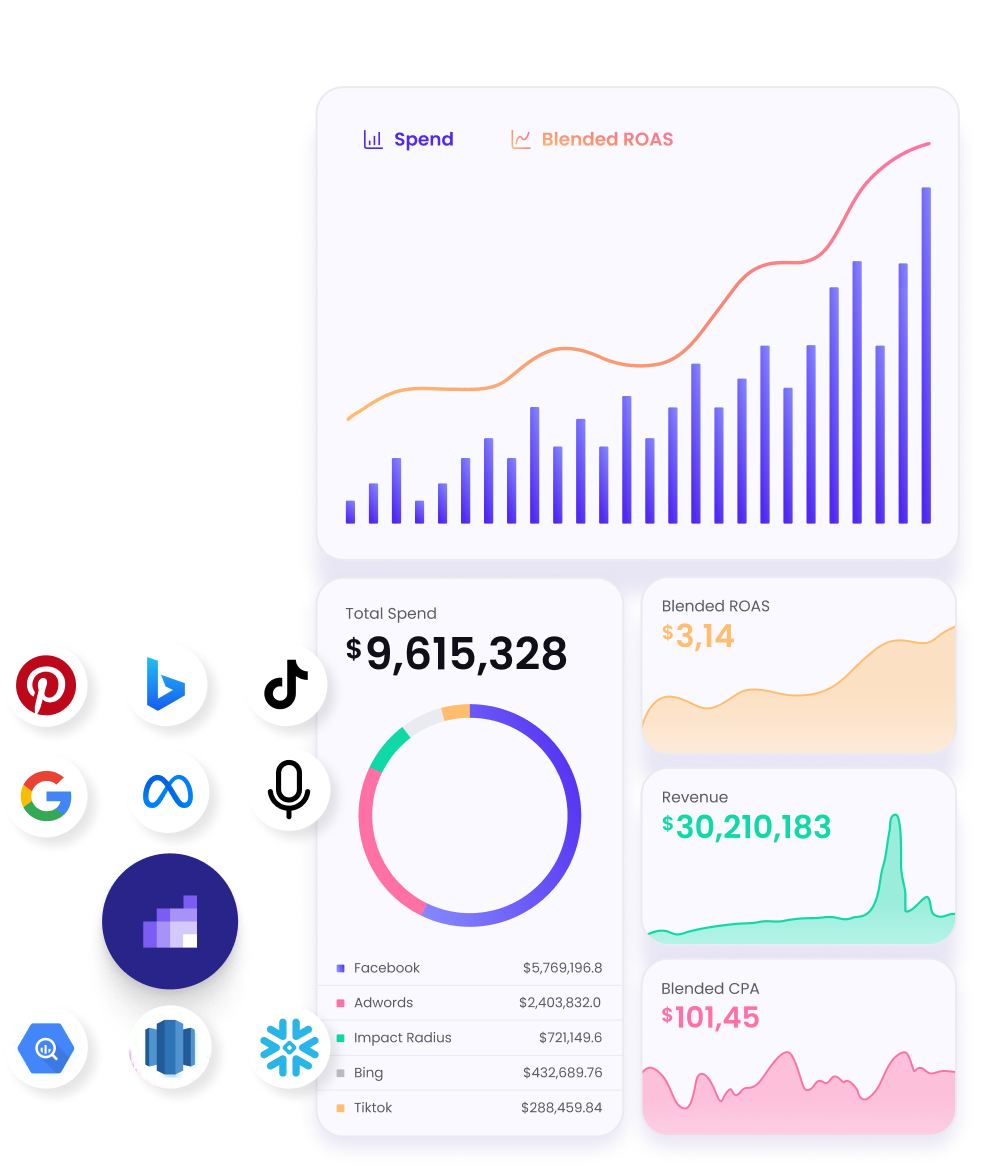
Rockerbox Unified Measurement brings Multi-Touch-Attribution (MTA), Marketing Mix Modeling (MMM), and Testing into a singular view of your marketing performance—powered by your data foundation, centralized and structured by Rockerbox.


Reliable, Trustworthy Marketing Measurement
Rockerbox simplifies the complexities of multi-channel marketing measurement by unifying all your marketing activities in one platform. Combining the benefits of a marketing attribution software, a marketing-mix modeling tool, and an incrementality solution, all into one user-friendly platform. Three of the most important planning and attribution tools for marketing, unified with Rockerbox.
Our platform provides a reliable, unbiased data foundation layered with real-time marketing attribution that is both validated and calibrated by MMM and Testing:
- Multi-Touch Attribution (MTA): Understand the customer journey and optimize channel performance without manual tracking and analyzing.
- Marketing Mix Modeling (MMM): Take your historical learnings to the next level, leveraging findings to validate and calibrate your attribution model.
- Incrementality Testing: Validate the true impact of your campaigns and identify growth opportunities. With Rockerbox, you can confidently optimize media investments, improve marketing performance, and accelerate growth.


Case Study
Bringing Clarity to
Complex Marketing Strategies
Built for Complexity.
Designed for Scale.
Rockerbox brings together multiple methodologies to provide a comprehensive view of your marketing performance:
Data Centralization
Unified Methodologies
Customizable Insights
Expert Guidance

FAQs
The Better Approach to Measurement

See what’s working.
Optimize your strategies.