With ongoing economic tensions and an ever-changing digital landscape, it’s more important than ever to curate your tech stack to include the tools you need to evaluate your marketing and make better decisions. Just last month we released a huge update to our entire platform that makes it even more suited to helping marketers understand their marketing (and optimize it) like never before—and provides a brand new modern look to boot. In this post, we’ll dive deep into the new and enhanced benefits that Rockerbox's reimagined UI brings to your company.
A Quick Snapshot of Your Marketing Health
Starting from the homepage of your Rockerbox account, we’ve made it easy to see key account metrics at a glance. You’ll be able to skim through blended ROAS and CPA over time, spend by channel, and see any saved views—another brand new feature. If you have reports that you or your team frequently uses, you’ll be able to save those and access them easily from the homepage, which simplifies your regular reporting process.
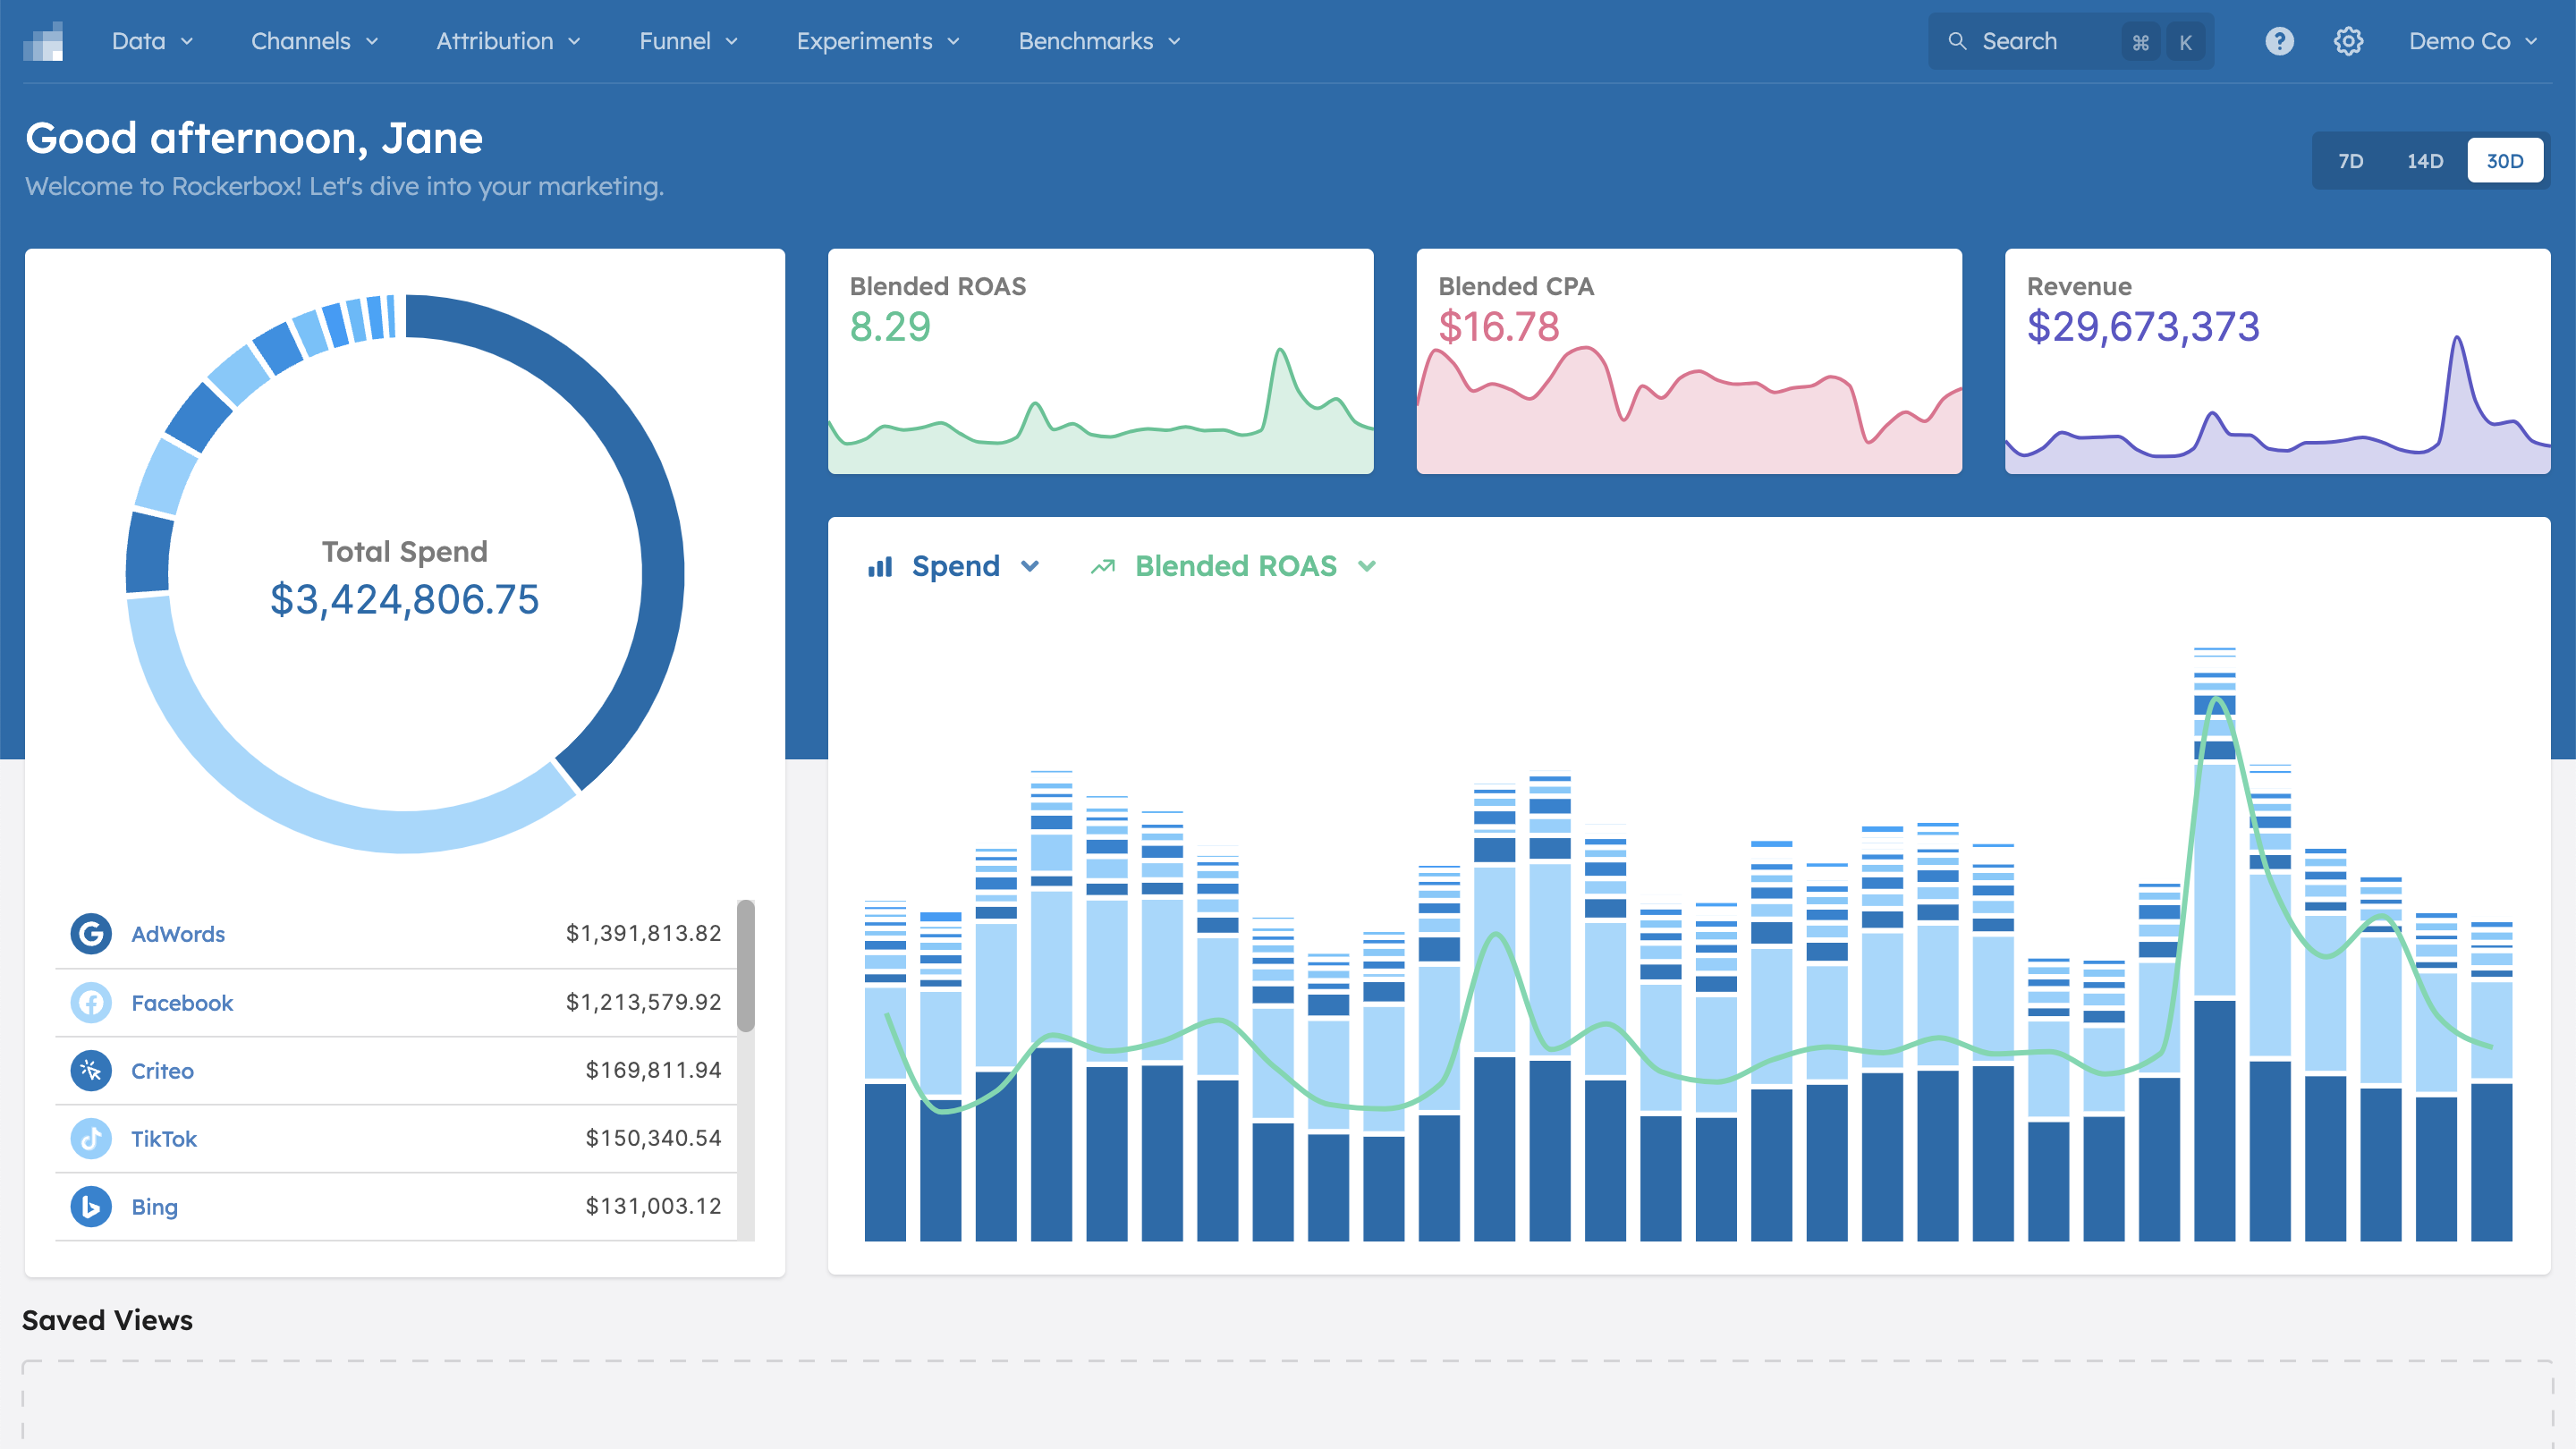
On the homepage, you can also get a glance at the brand new navigation in Rockerbox, which organizes the key areas of Rockerbox into six tabs:
- Data
- Channels
- Attribution
- Funnel
- Experiments
- Spend Benchmarks — Another brand new view we’ll discuss more further down.
You’ll also notice the new search functionality, which makes it even easier to get to where you need to go in Rockerbox.
See the Power of First-Party Measurement
Rockerbox’s reliable first-party measurement is a hallmark of our platform, and one of the best places to see it in action is in the Digital Ad Platforms view where you can see our data alongside ad platform data, which can report an incomplete view of a channel’s impact.
With the Digital Ad Platforms view, you can see just how different platform and Rockerbox numbers can be and toggle between attribution methods (modeled multi-touch, even weight, last touch, first touch, full credit, full credit) to view the data in multiple different ways.
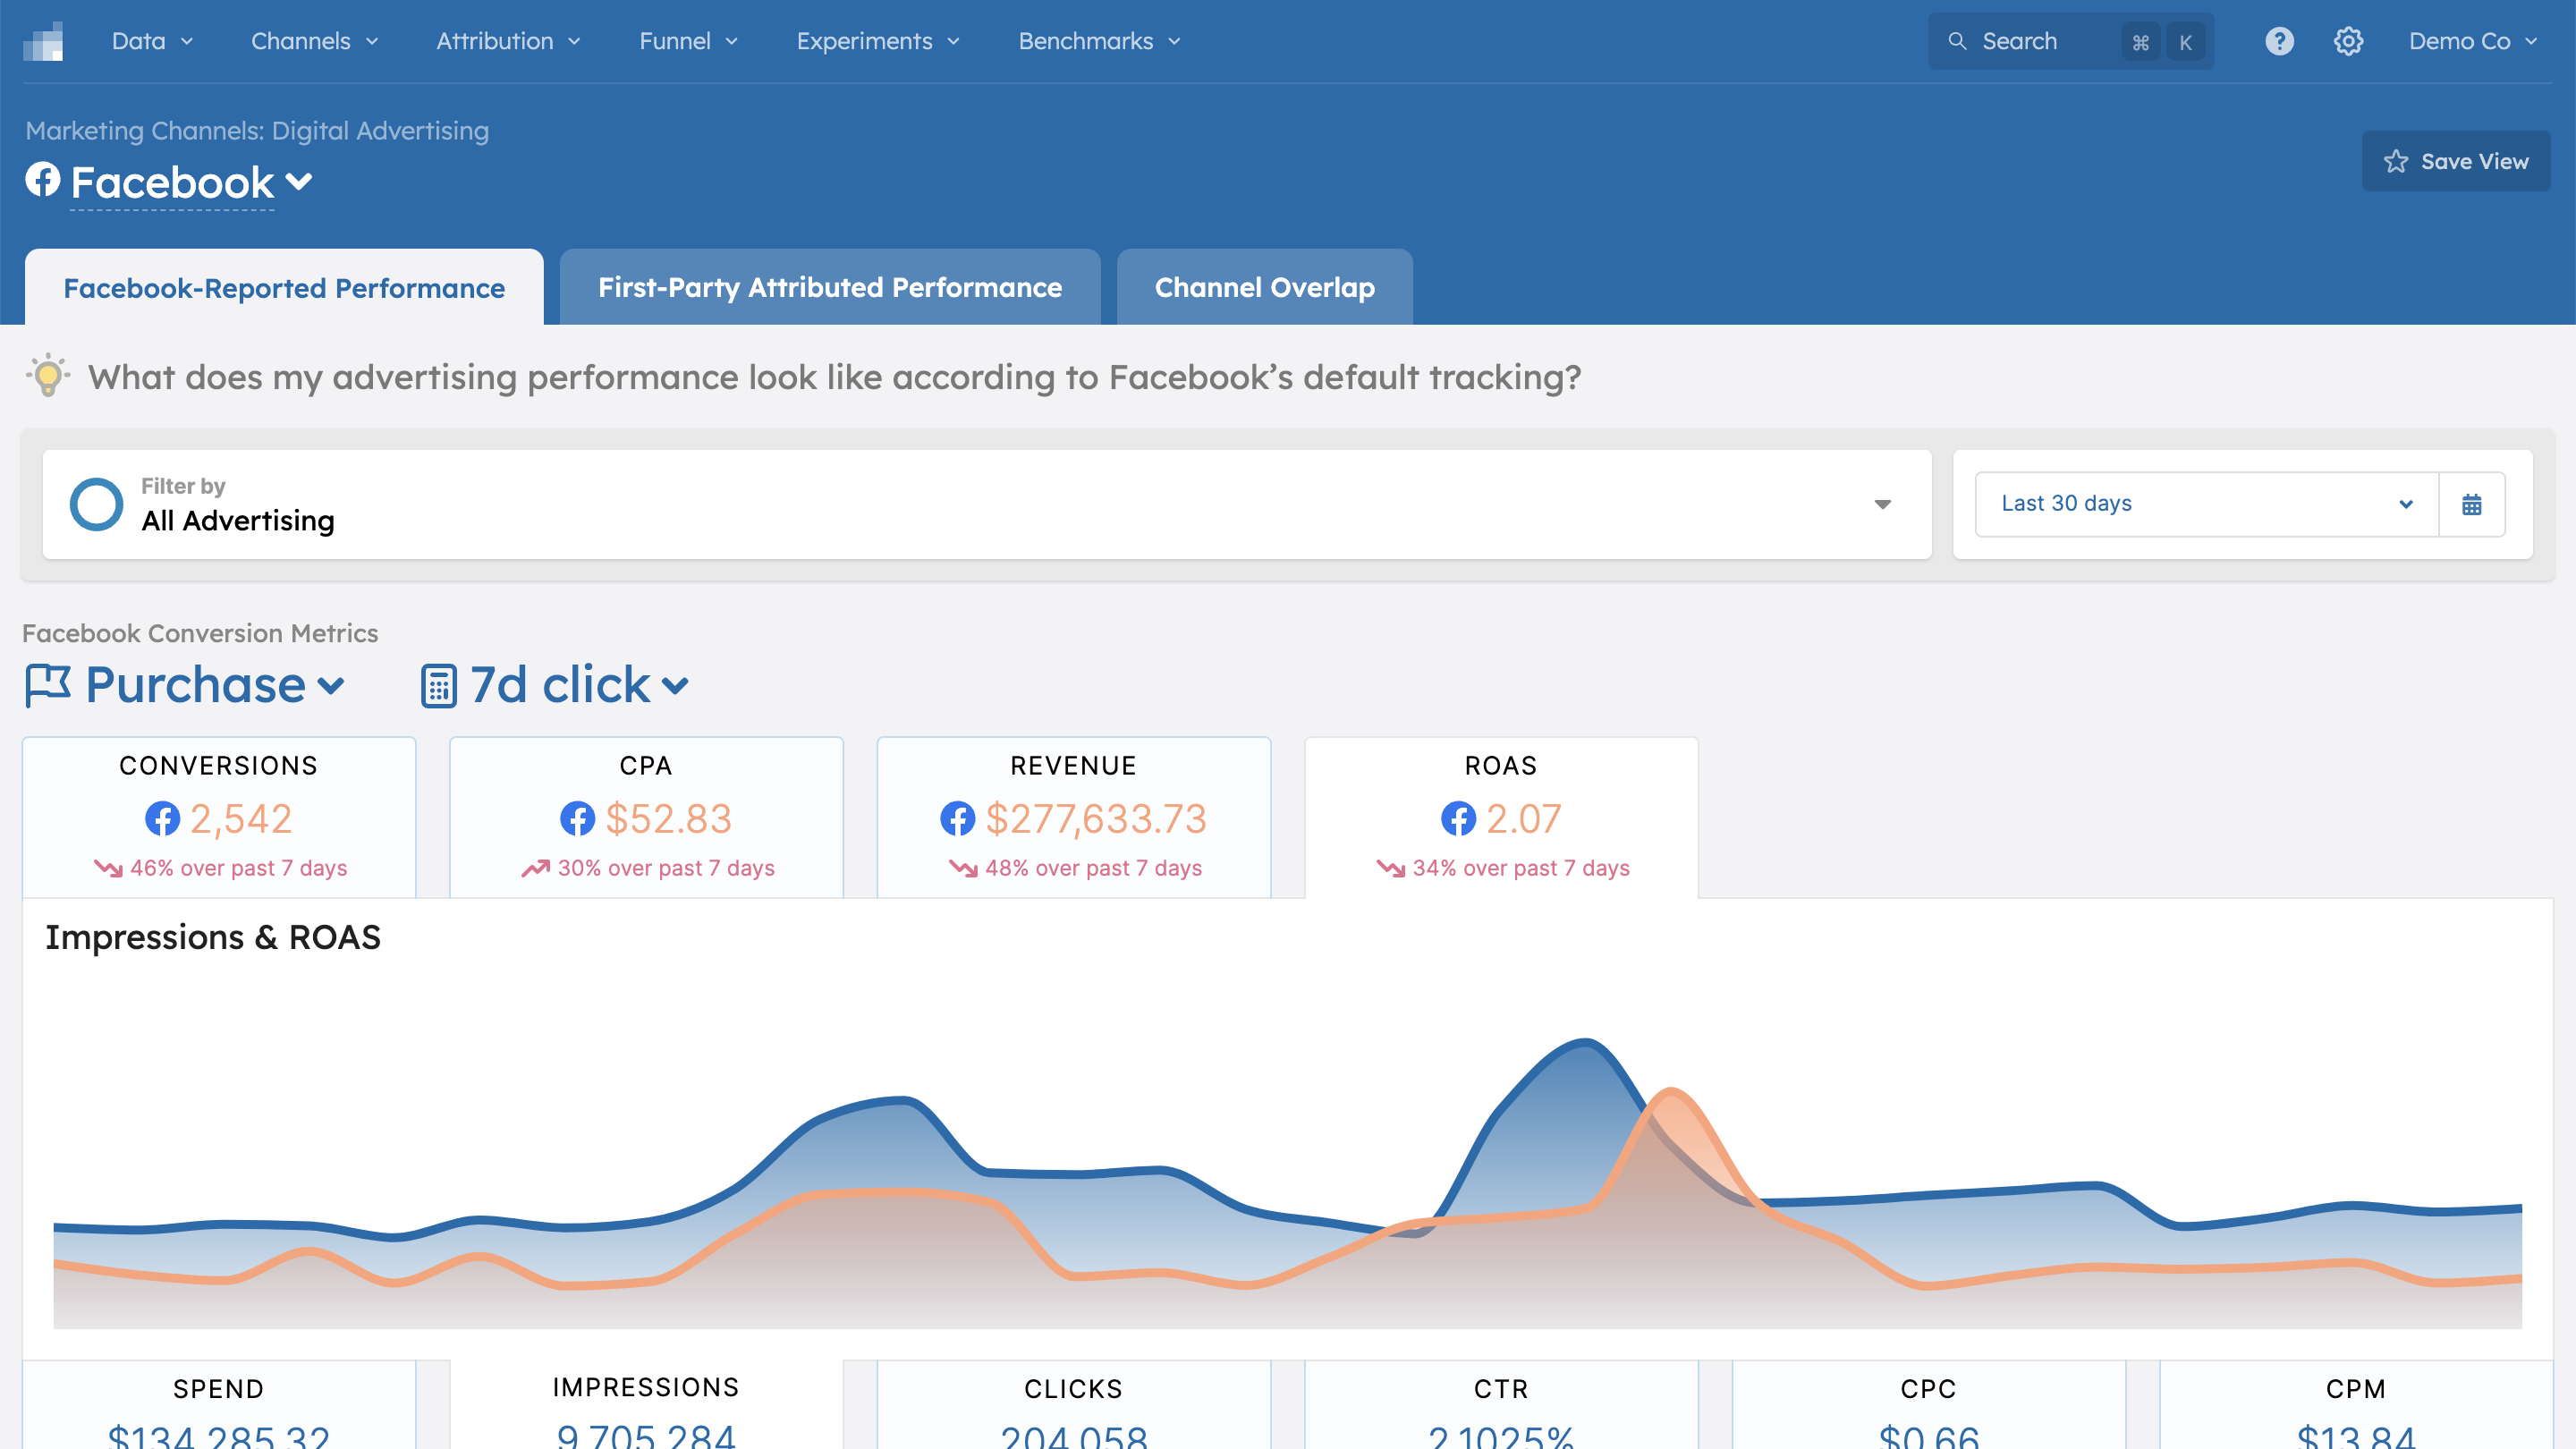
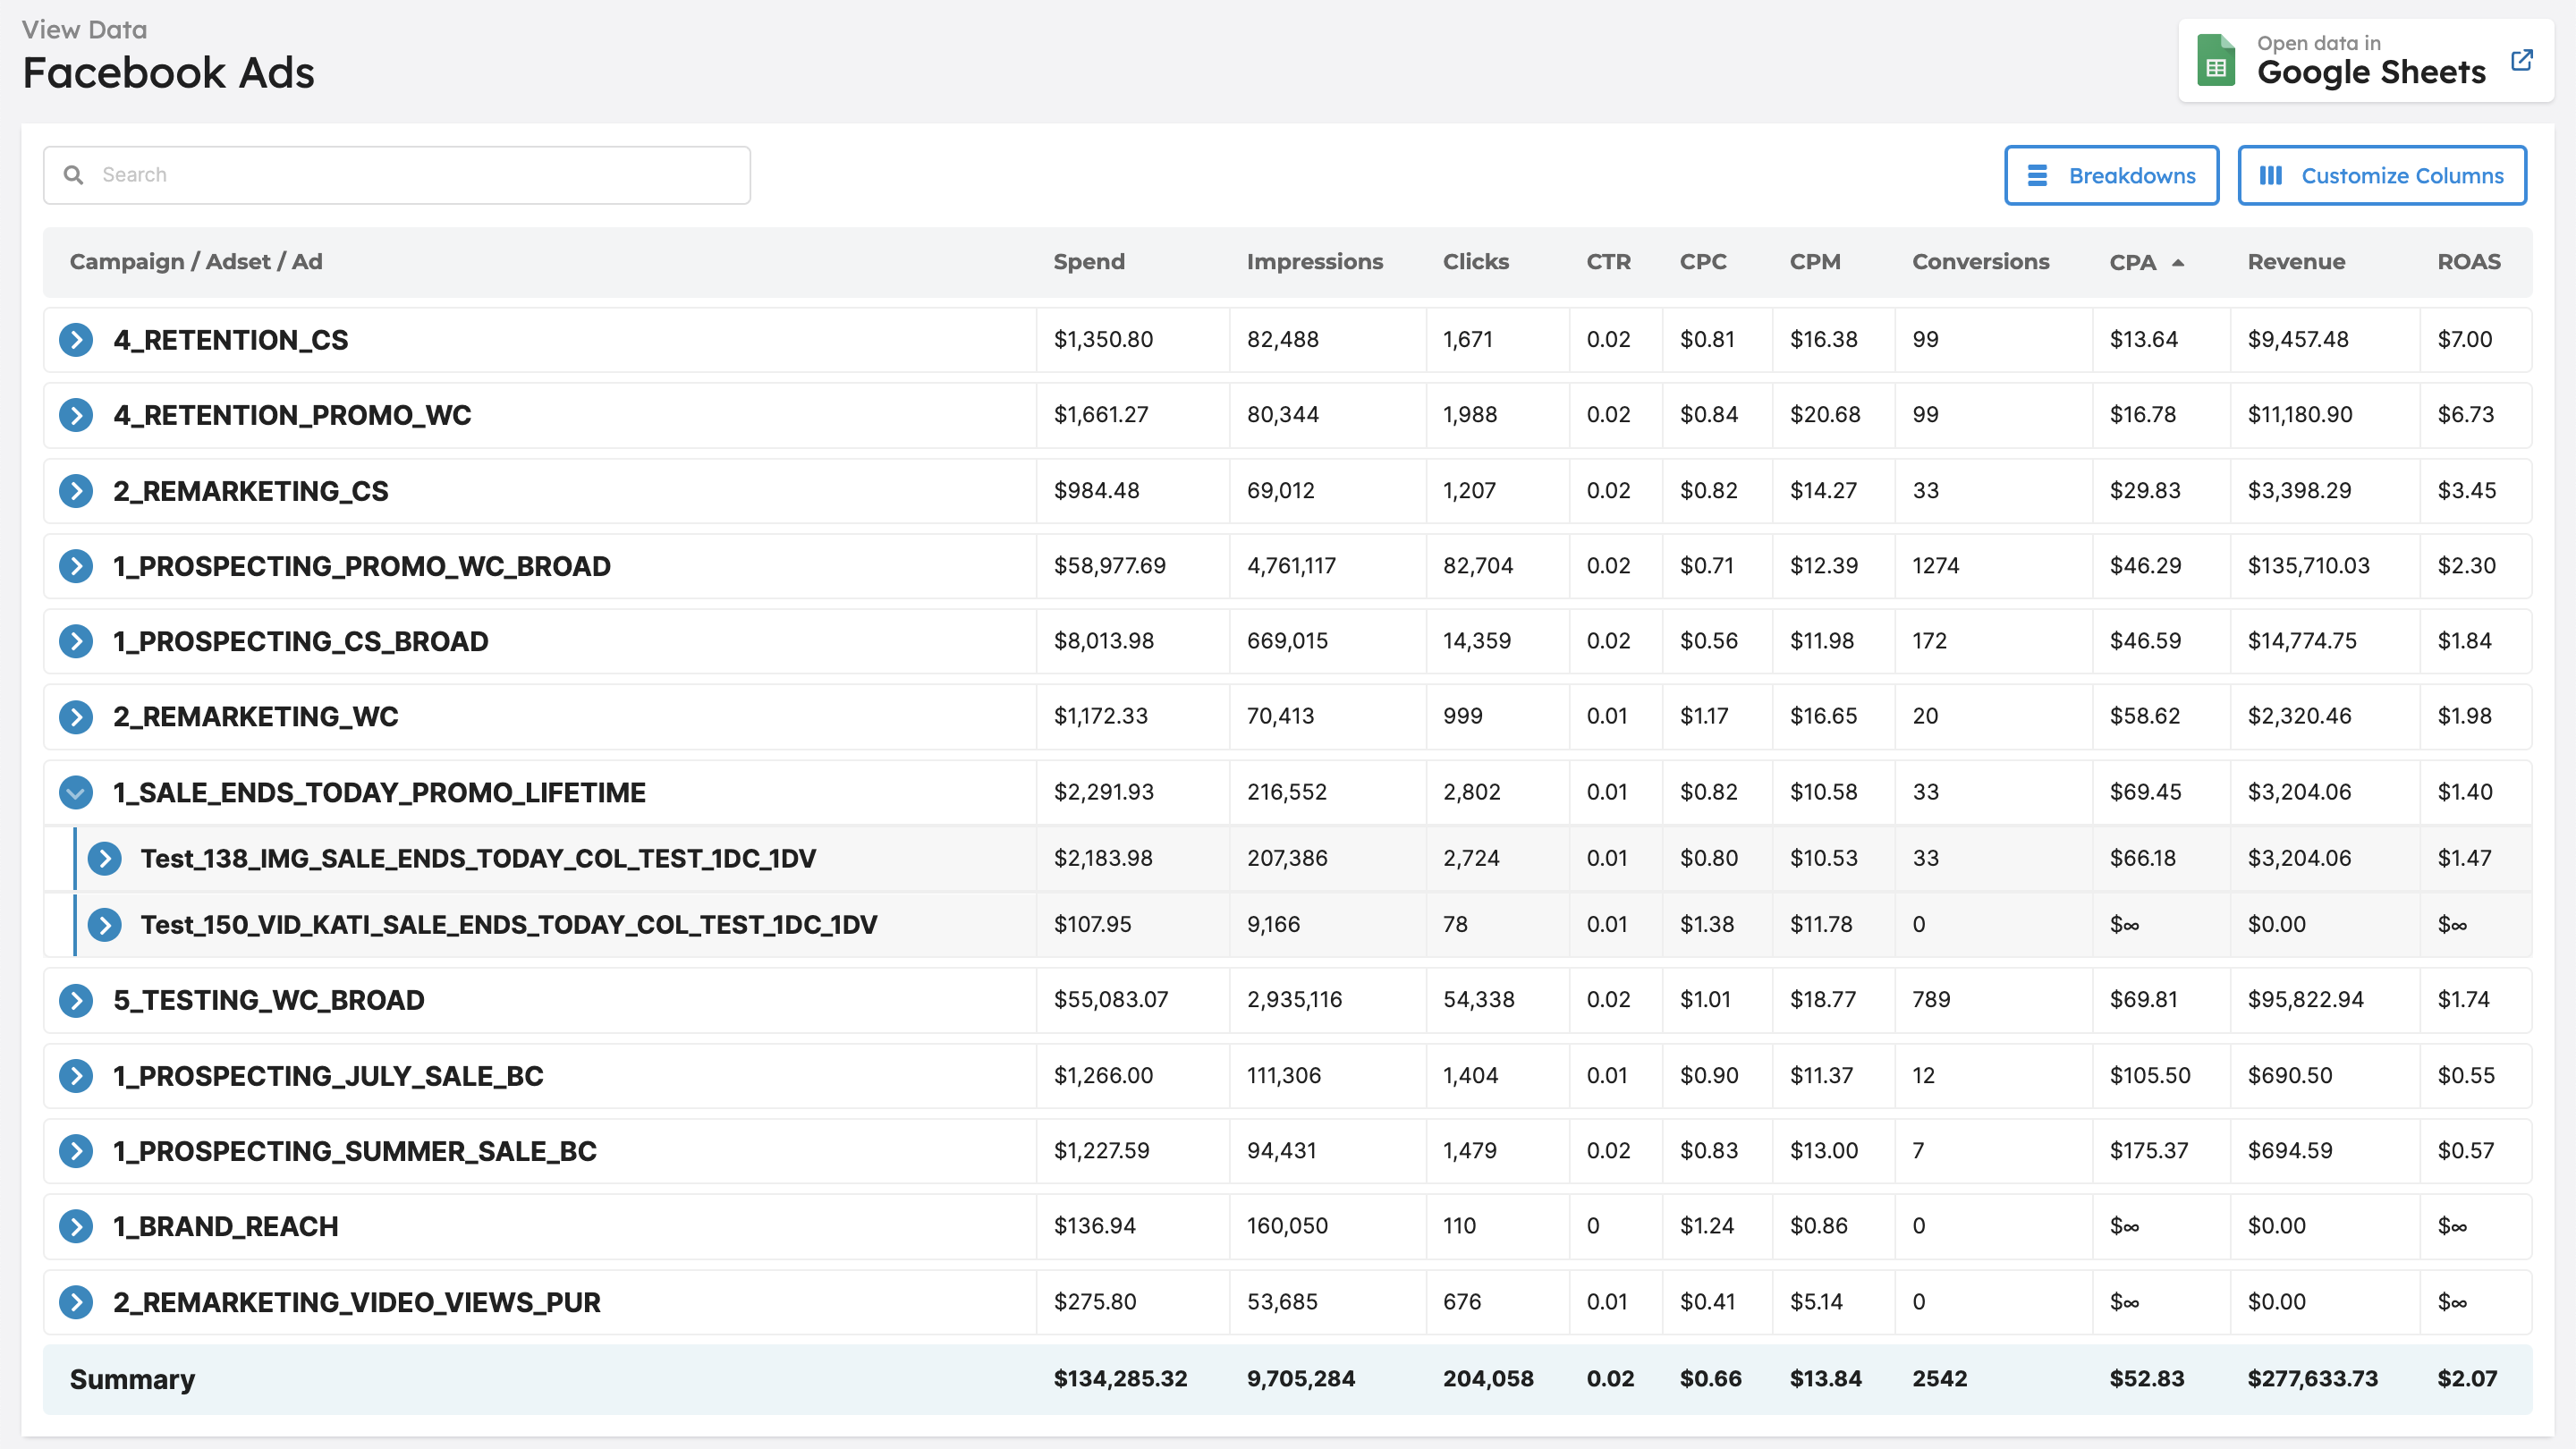
In addition to the trends shown in the graph, you can also see a granular view of all the data, even down to the ad level, and you can look at the selected platform’s own reported performance, including impressions, clicks, CTR, and CPC.
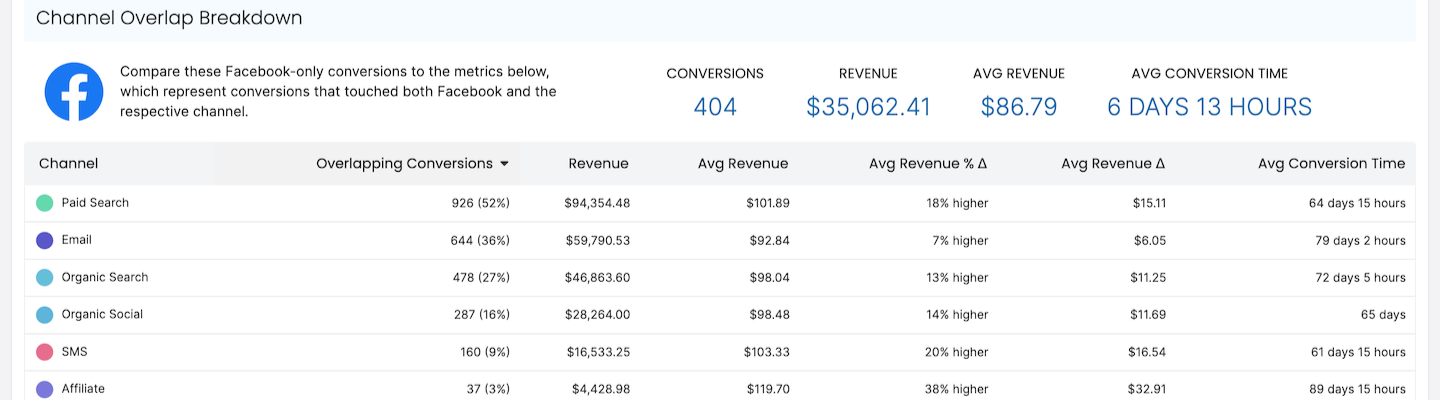
Identify and Assess Channel Overlap
Chances are if you’re marketing on multiple channels to similar audiences, you have some overlap between the people that are seeing your ads on different platforms. Sometimes this overlap can help you to drive sales, while at other times it may not be affecting sales at all and simply be adding unnecessary cost.
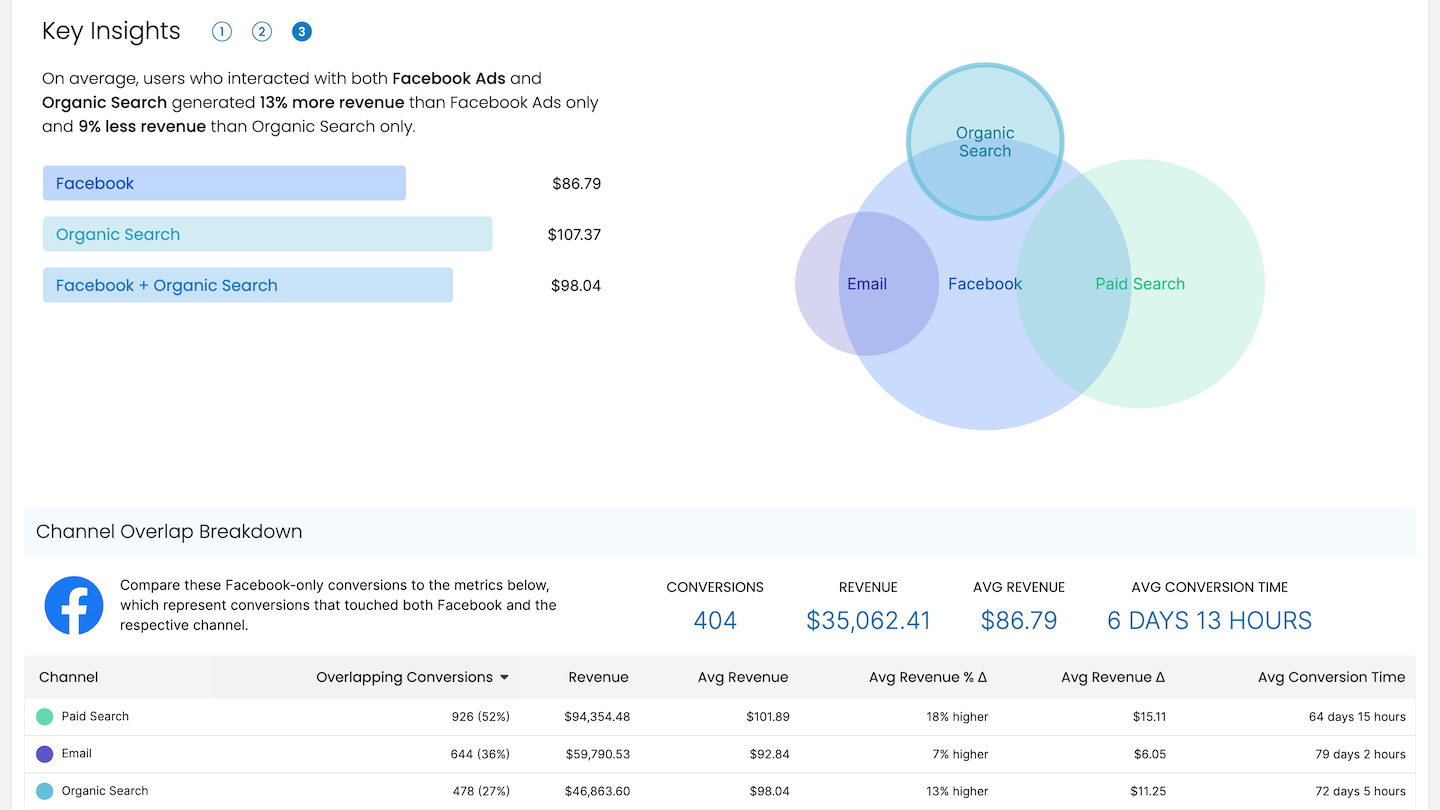
In the Channel Overlap view in our revamped UI, you can see which additional marketing channels users that are interacting with one channel are also interacting with. This helps you understand the additional incremental performance lift you're seeing from marketing channels and understand whether the overlap of channels is helping or hurting you.
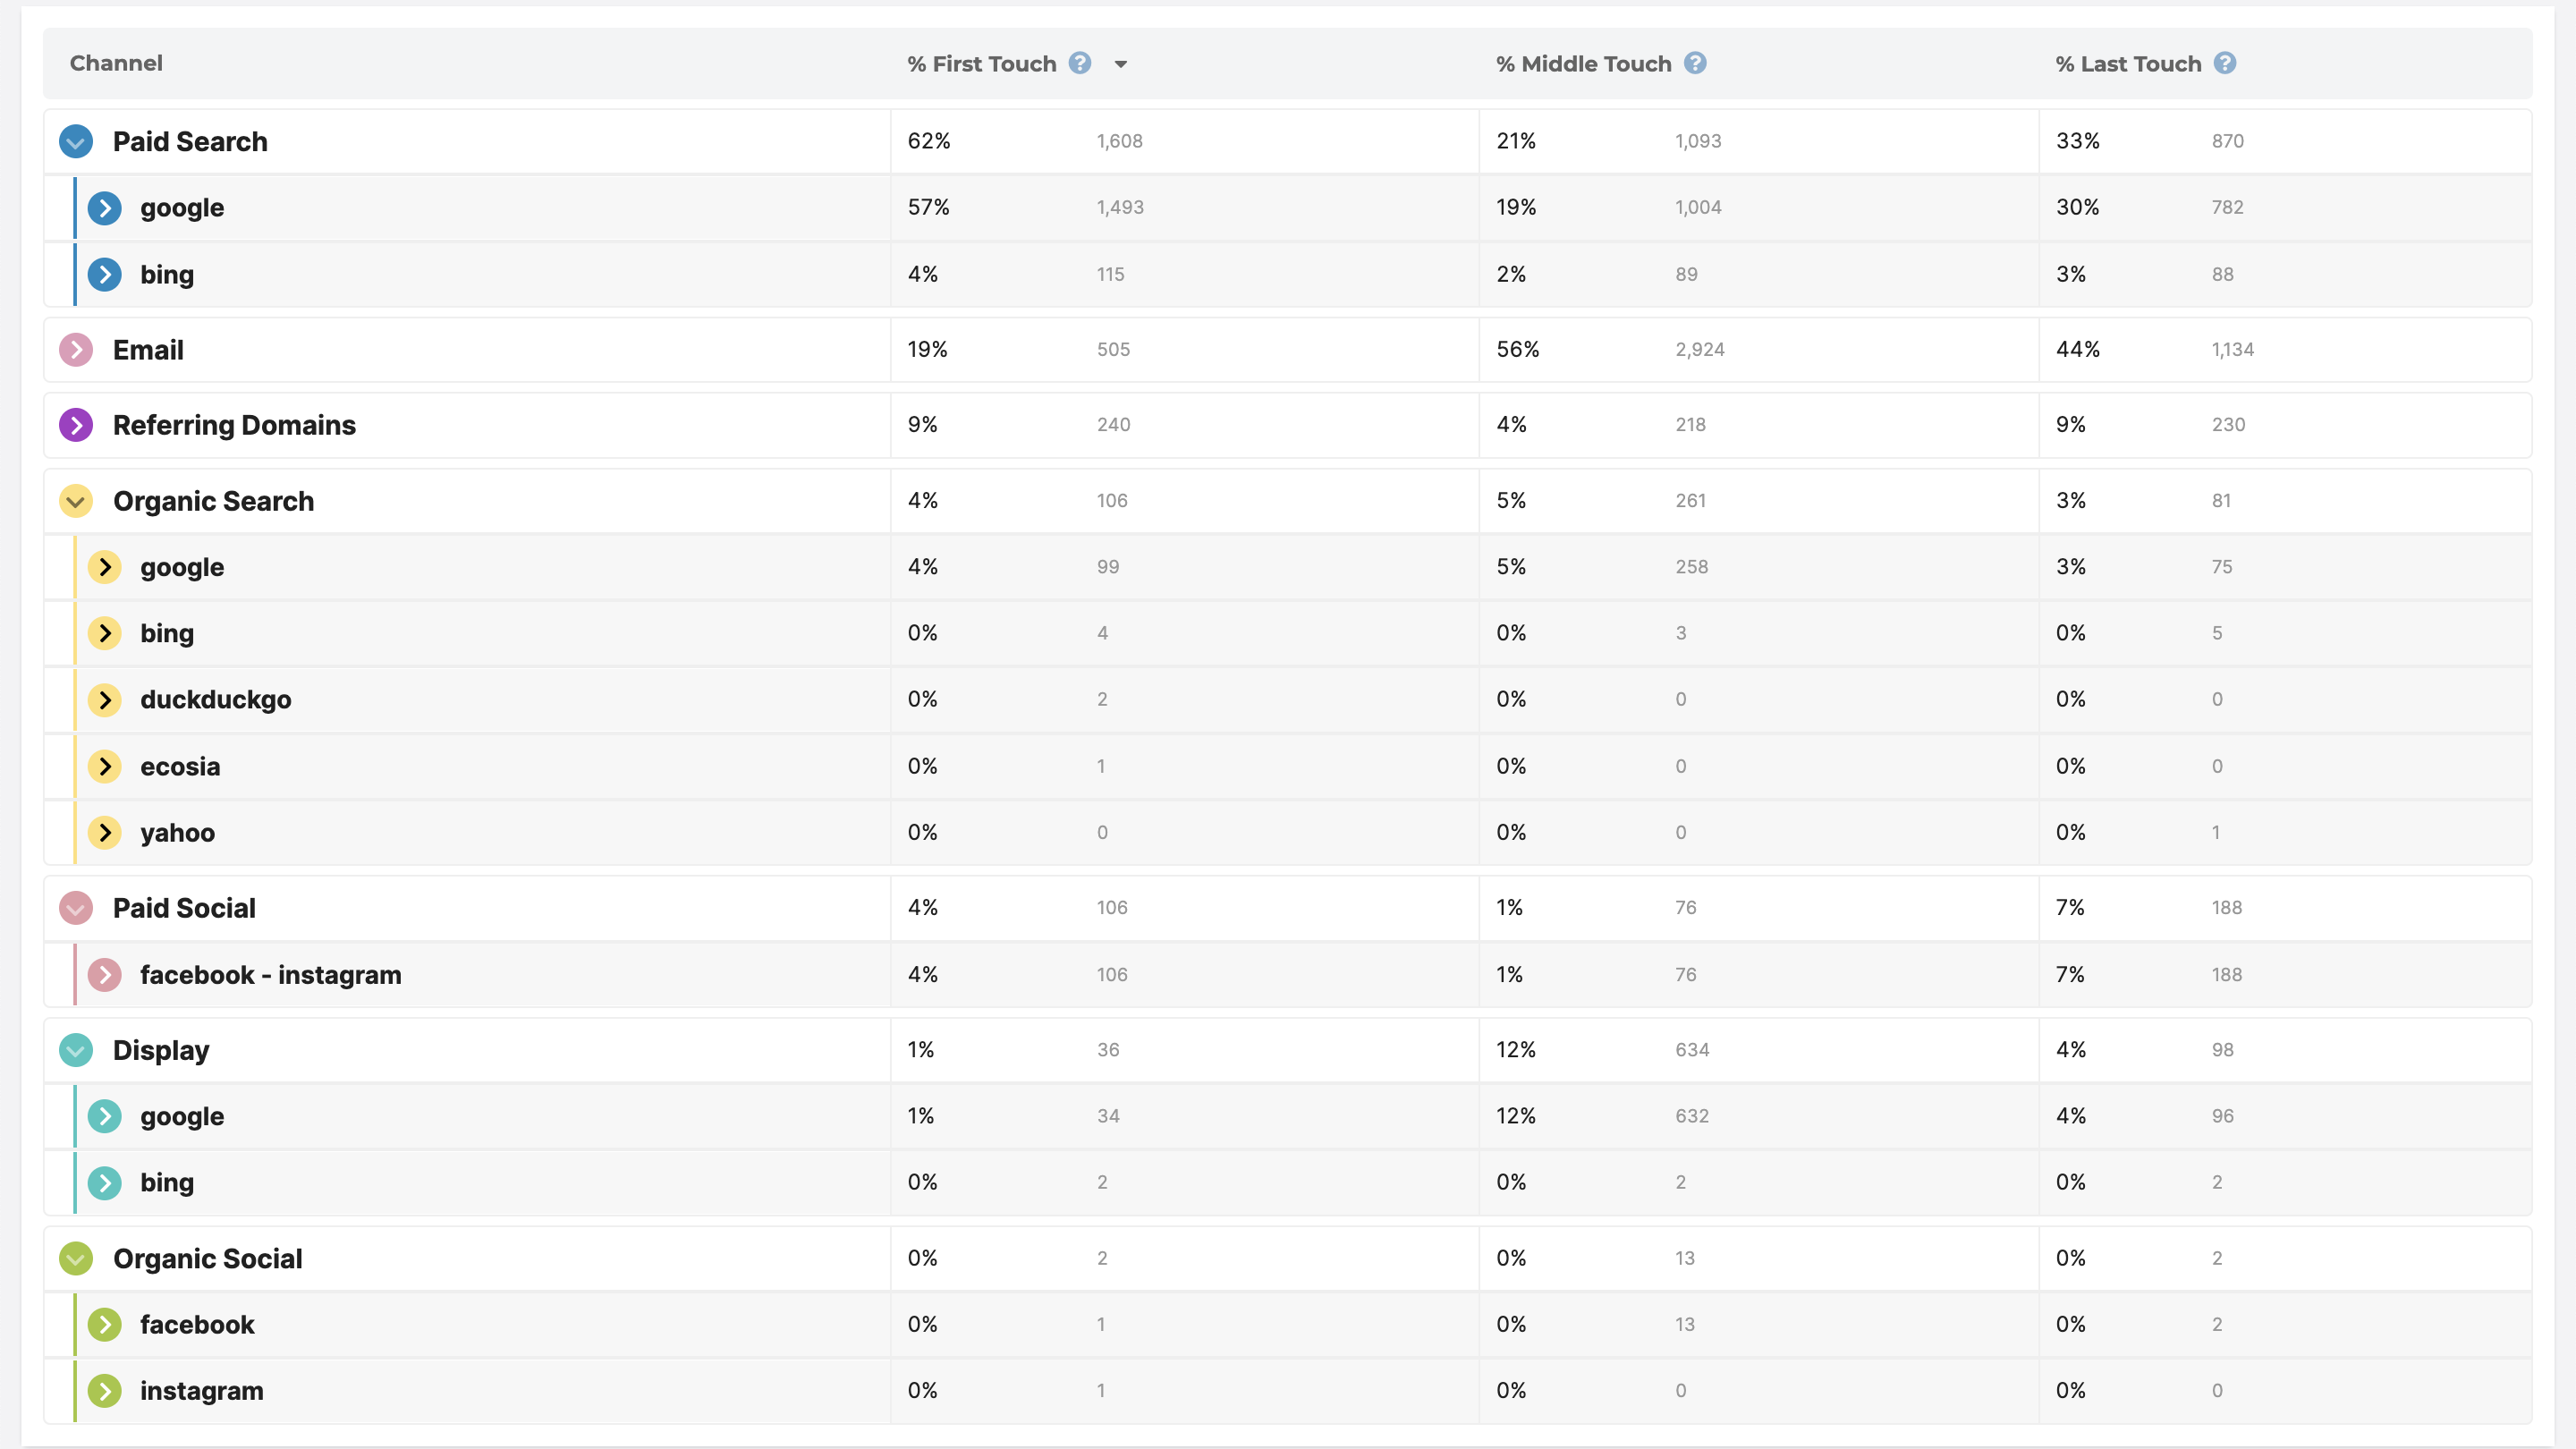
Gain a Deeper Understanding of the Buyer Funnel
Buyers often engage with multiple different touchpoints before they actually decide to purchase. Understanding which touchpoints are having the biggest impact on your bottom line is key to knowing what to invest more marketing budget in.
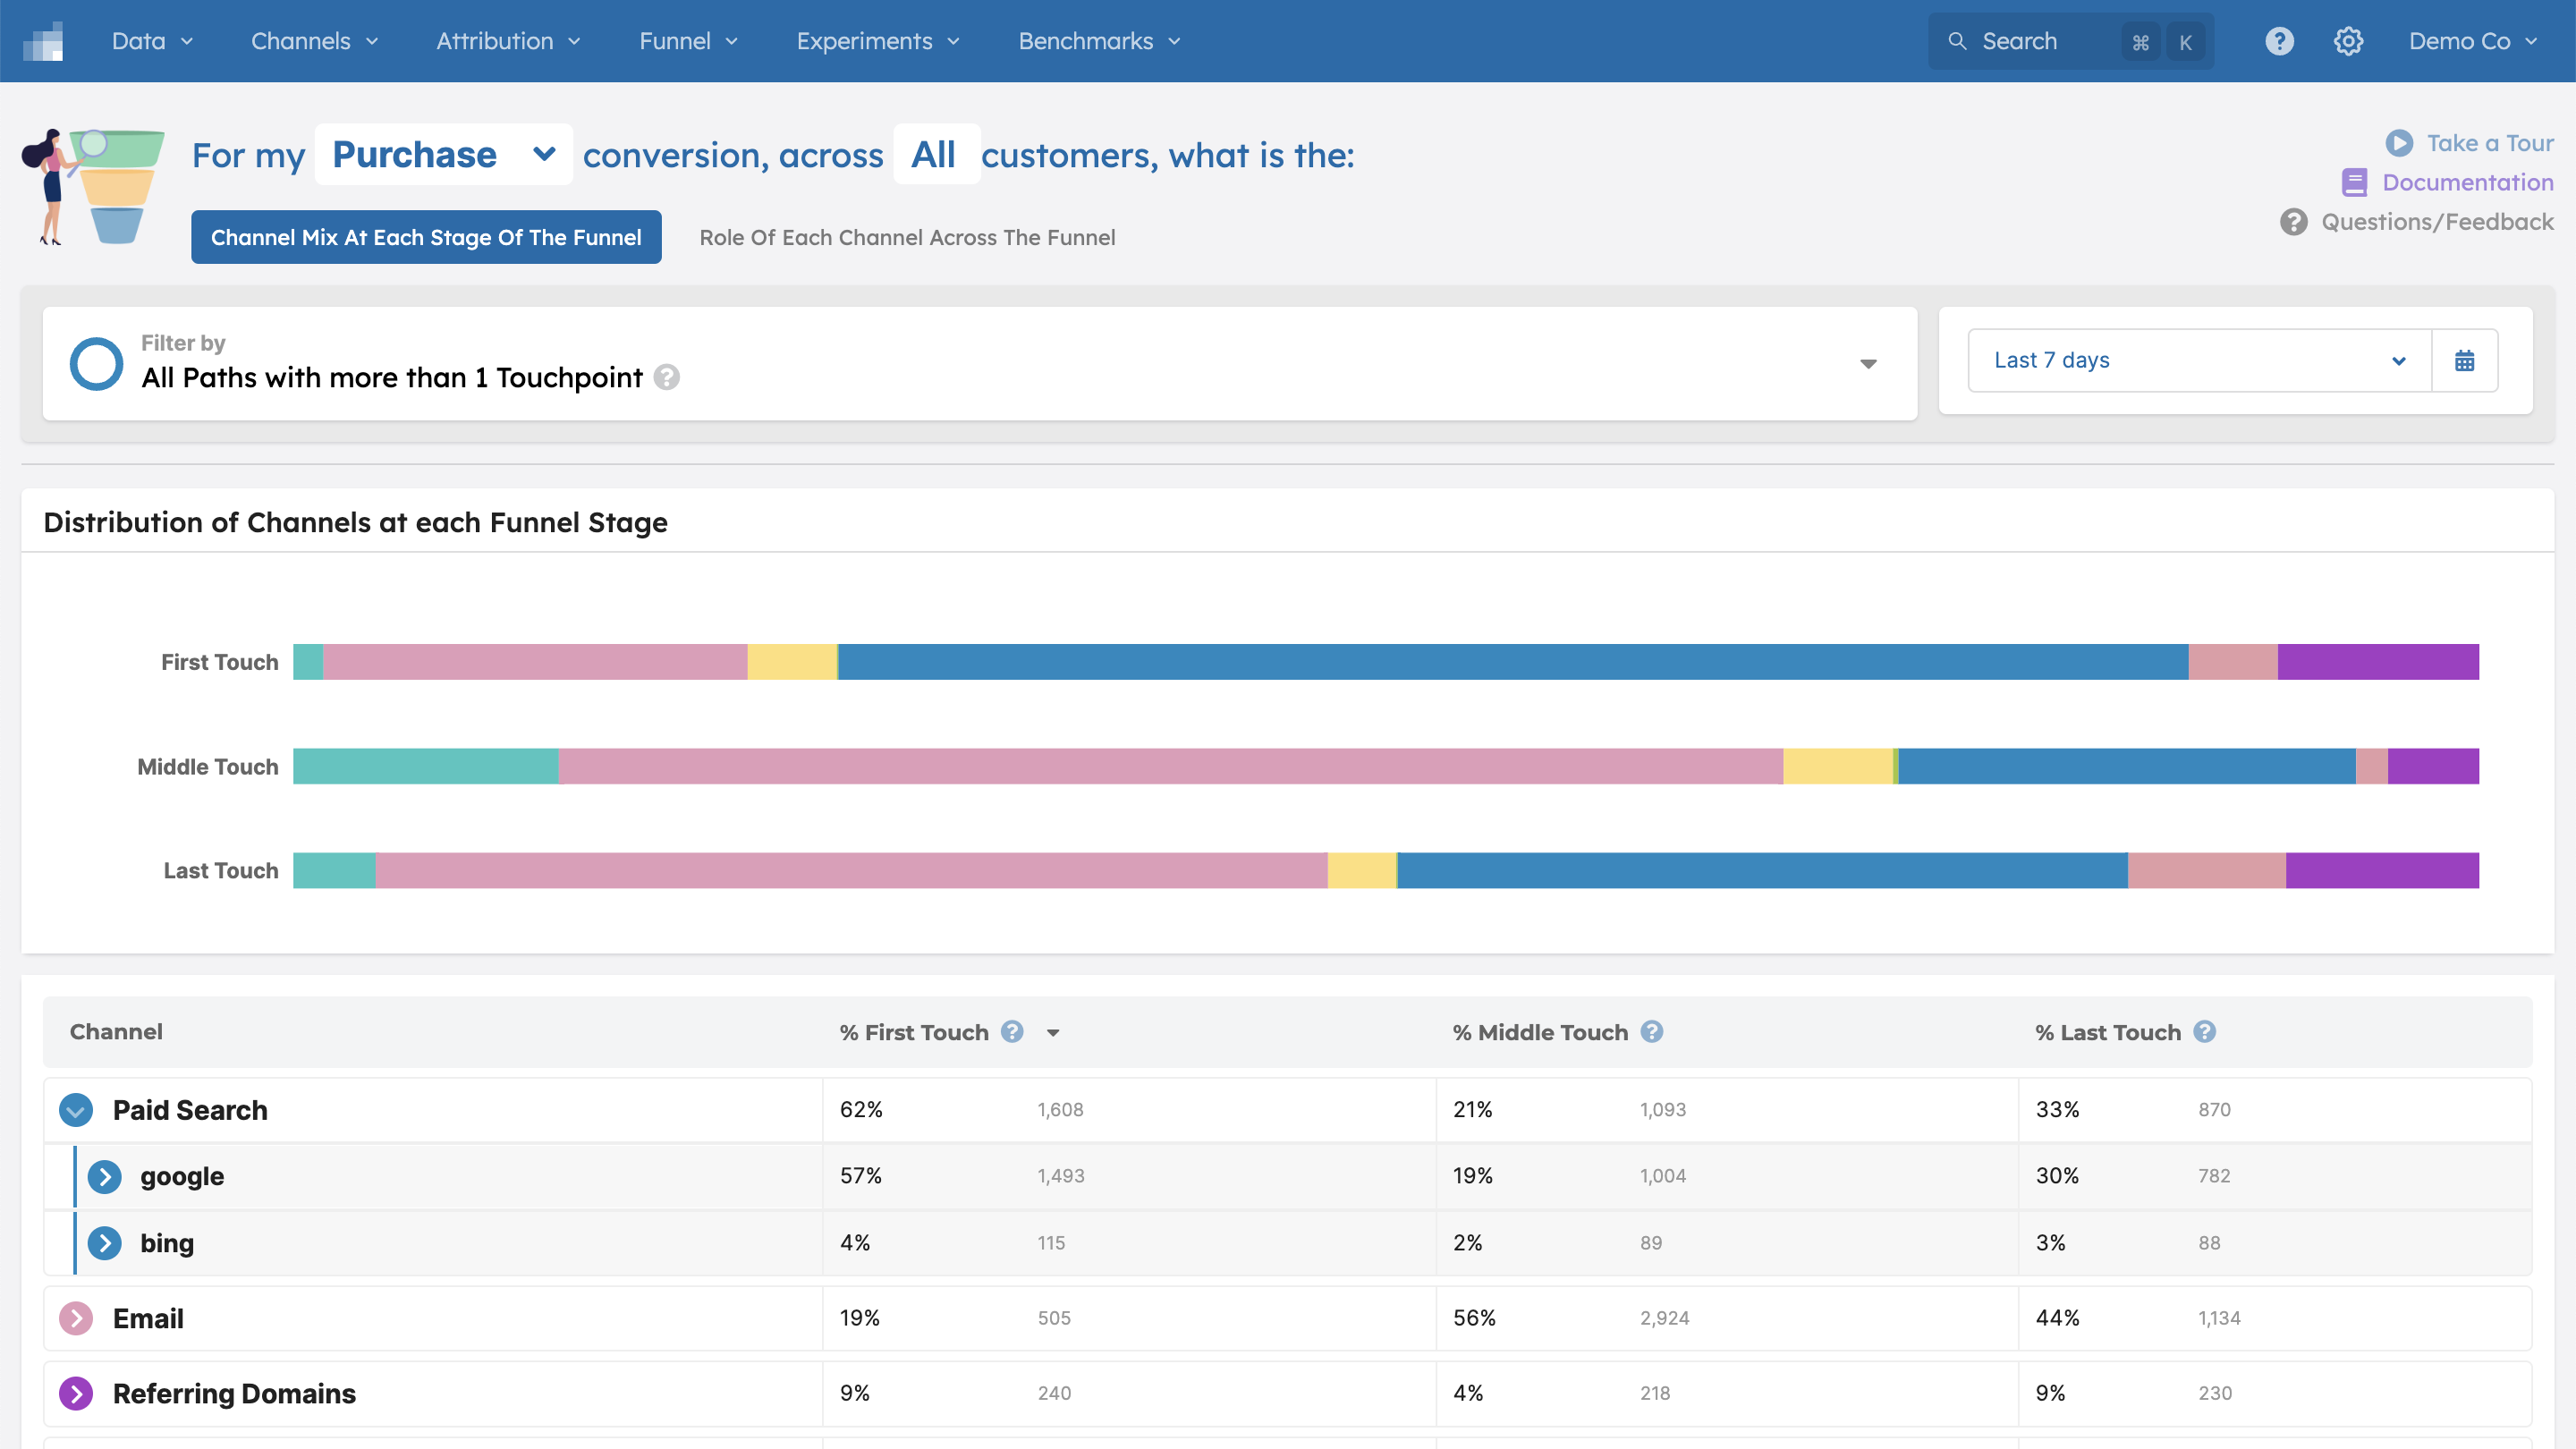
In the newly revamped Rockerbox, you can easily dig into your buyer funnel to see which channels are contributing to sales and which aren’t. You’ll also be able to see this information by funnel stage, with insight into the marketing mix by stage and the role of each channel across the funnel.
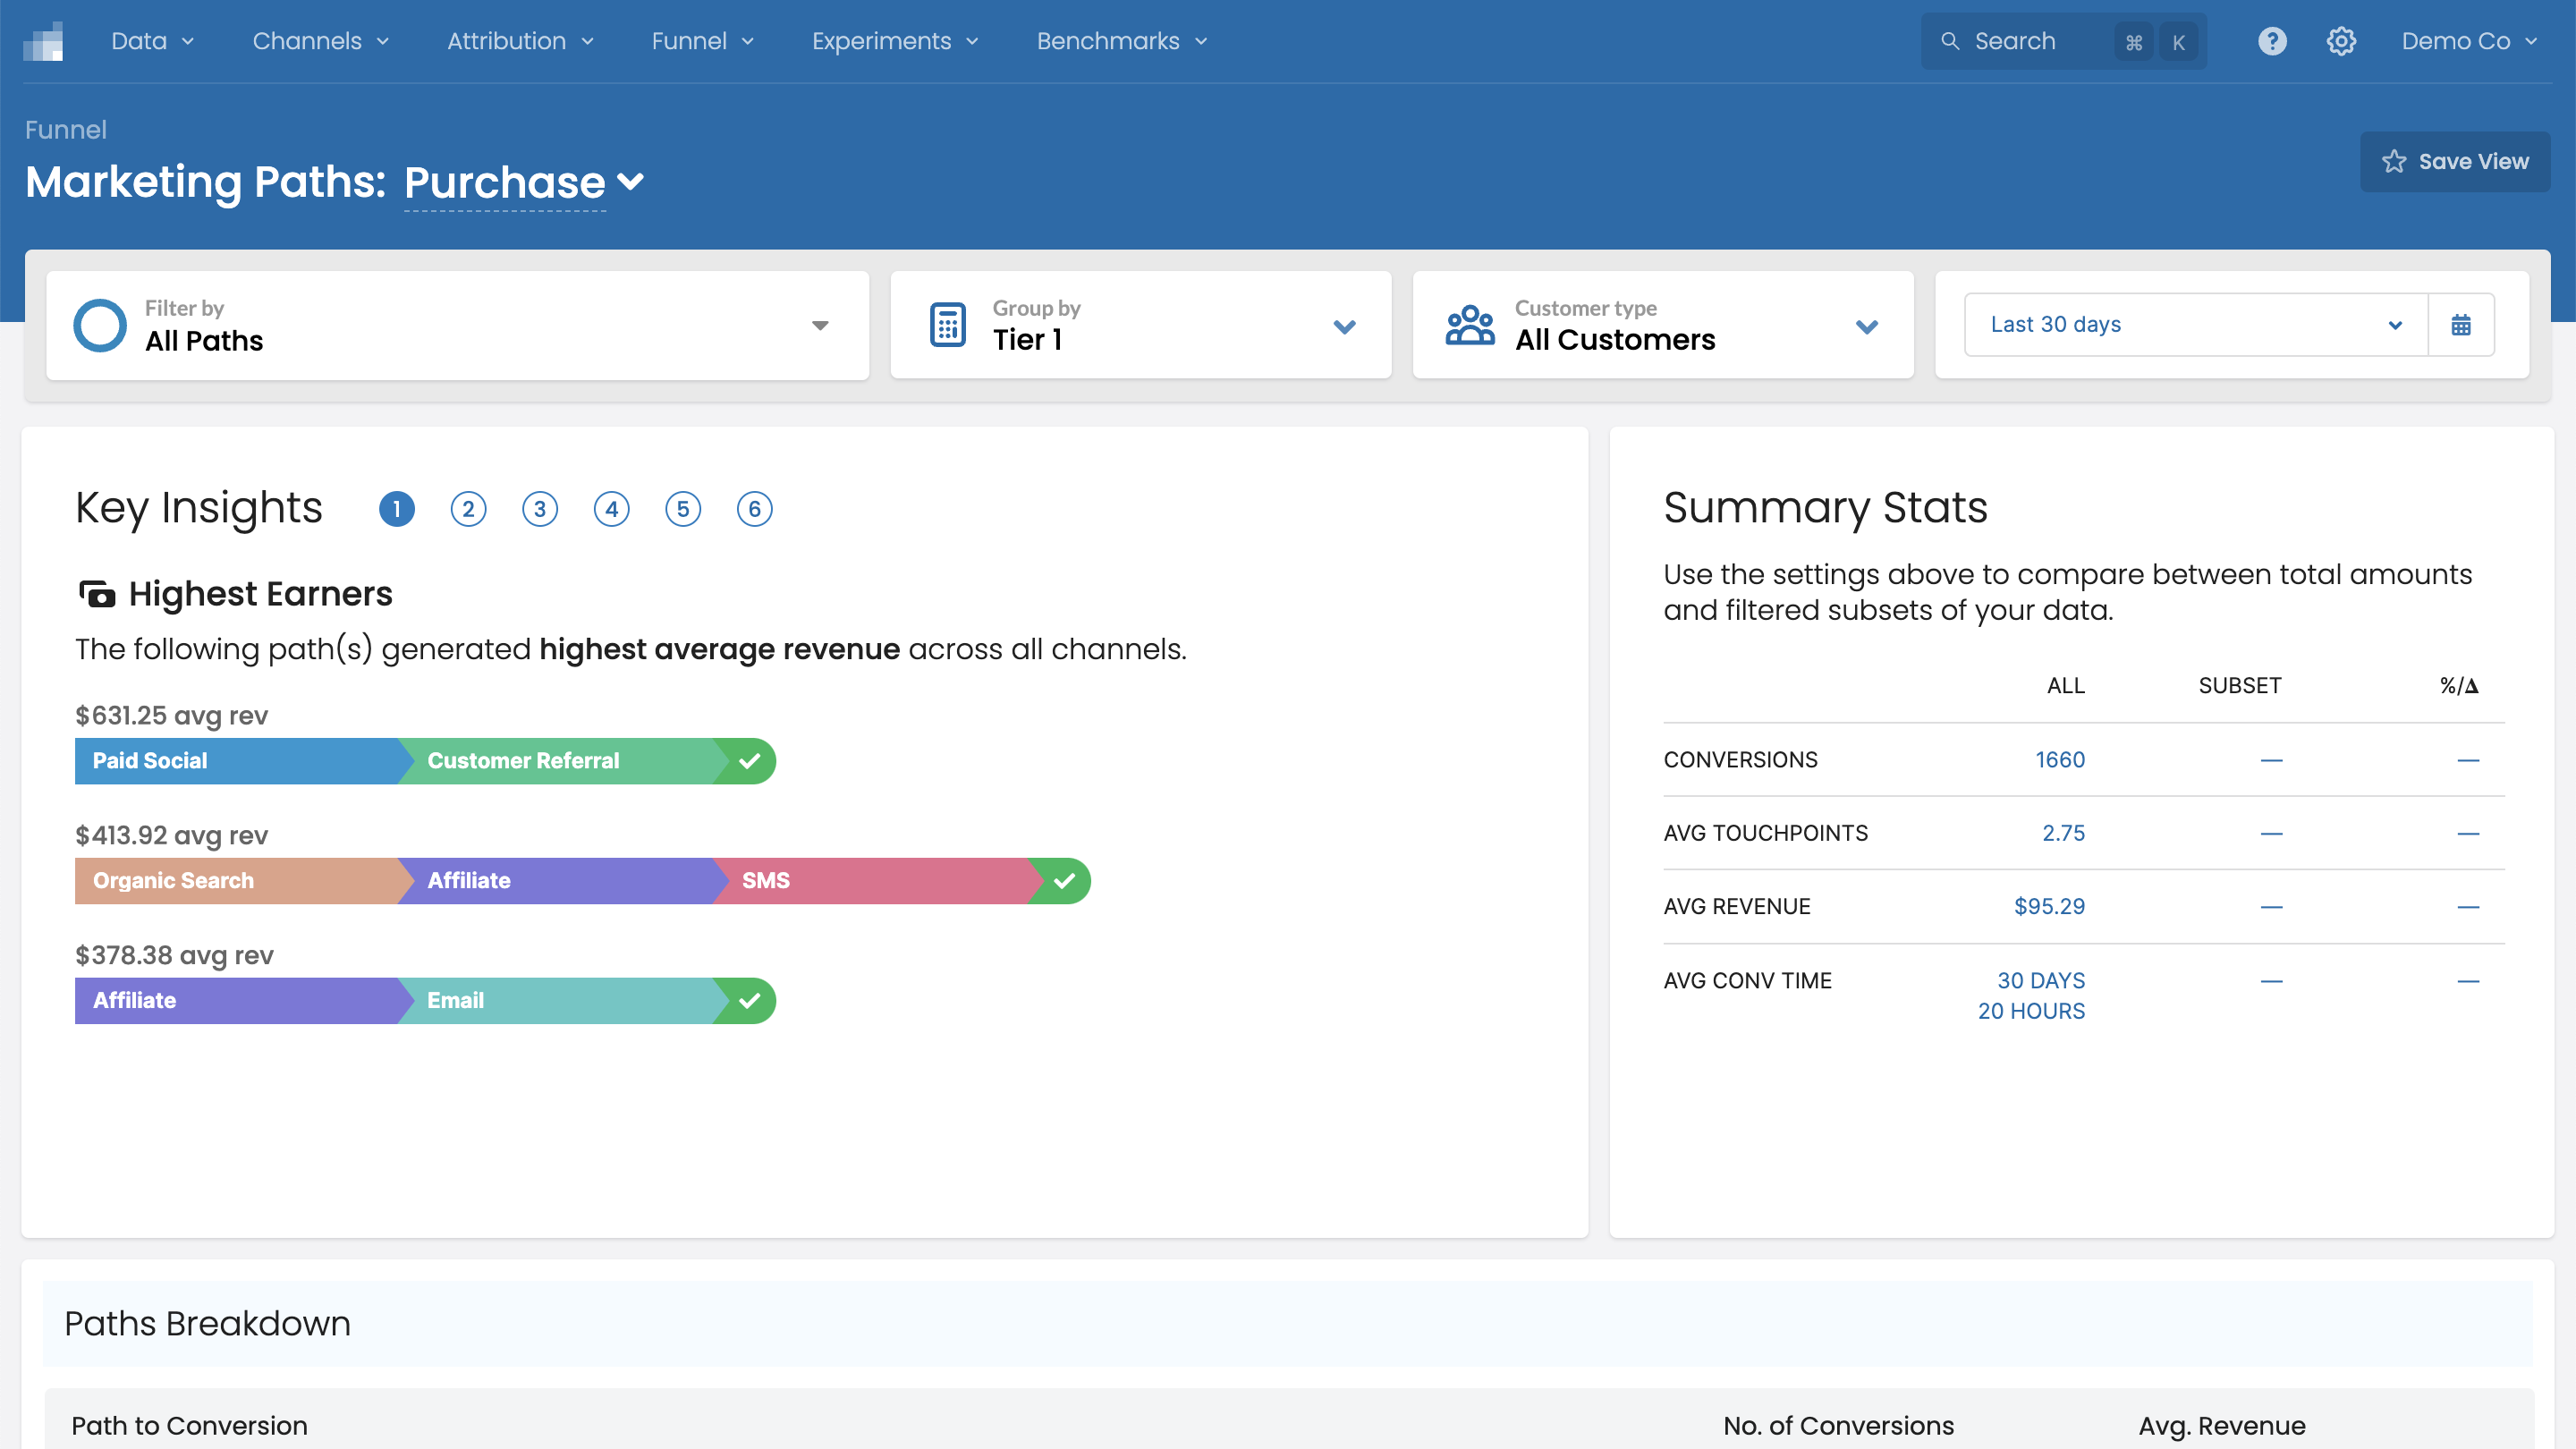
The key insights sections we’ve added to the platform help you cut to the important information even more quickly. On the Marketing Paths view, for example, you’ll be able to find out things like the highest earning paths and the paths with high revenue but low volume, which show areas where you can up your investment. These insight sections, which are also featured in several other places throughout the platform, give you easy-to-access, actionable insights that you can screenshot to strengthen your presentations and reports.
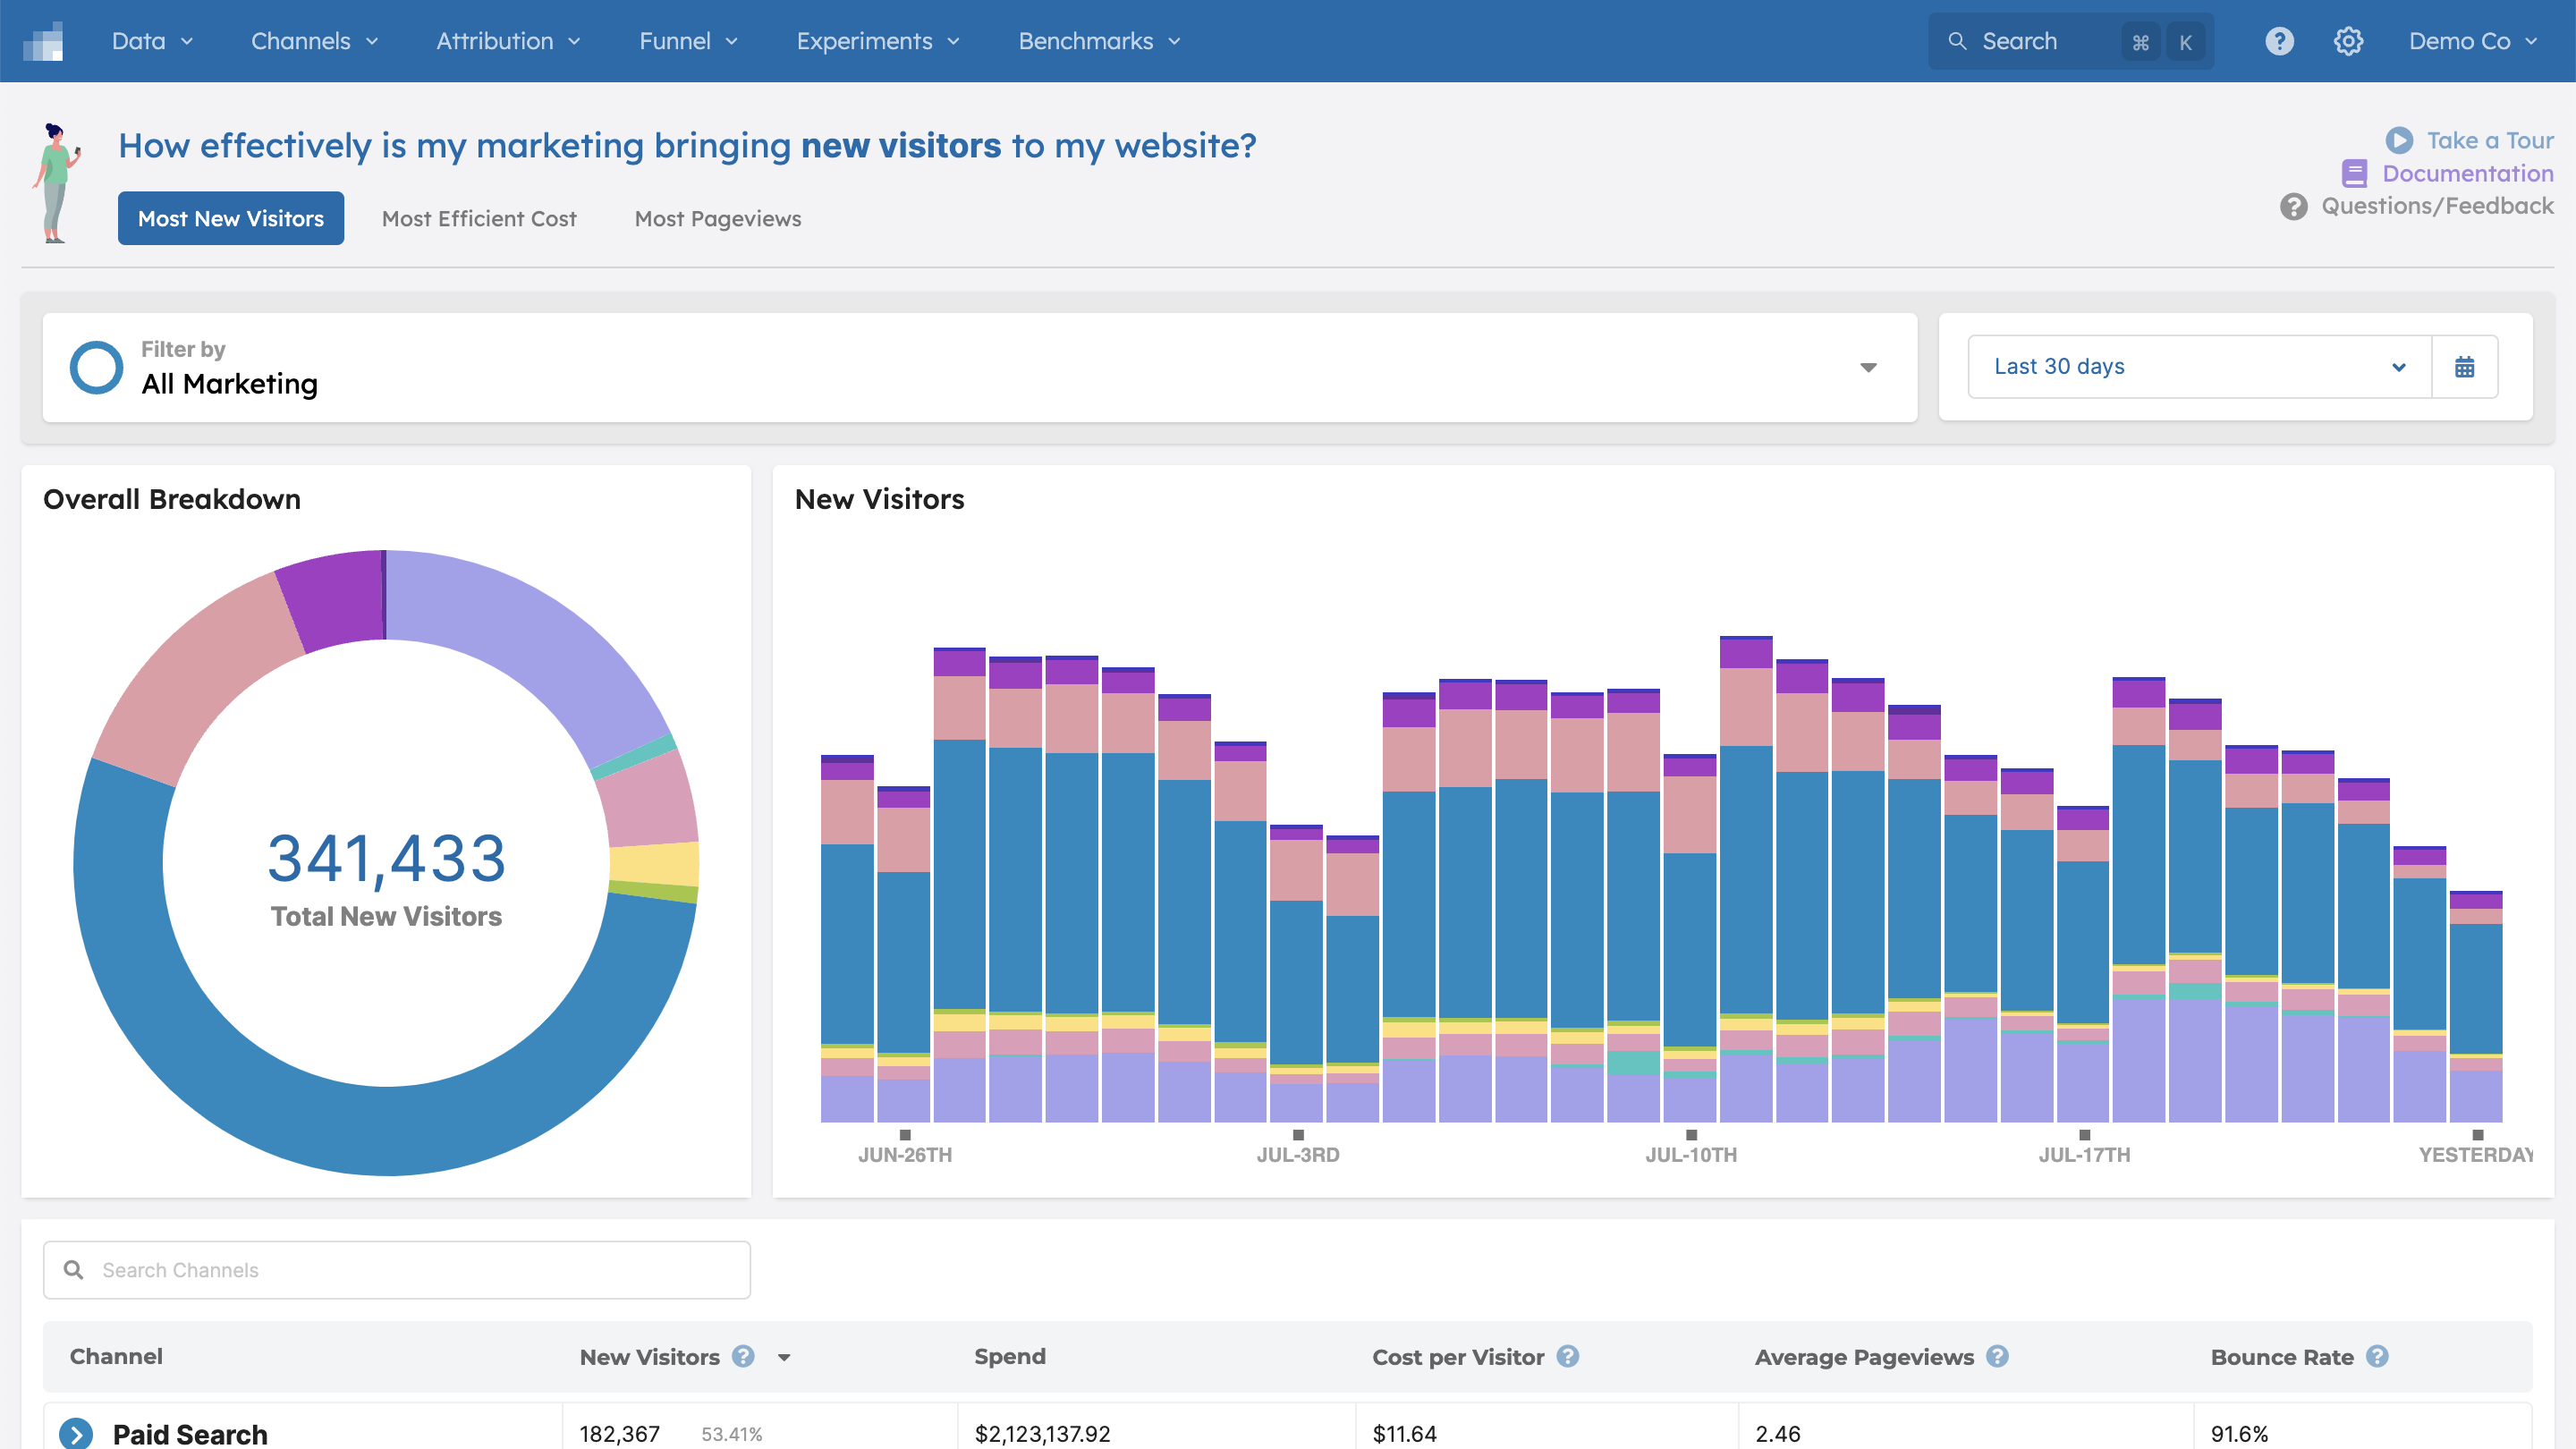
Pinpoint the Best Ways to Bring in New Users
Some channels are less effective at directly driving sales, but highly important for bringing in new site visitors who’ve never heard of your business. The new UI helps you dig into the impact of those top of funnel branding and awareness campaigns that are driving people to your website for the first time. In the New Visitors view, you can understand which channels are most effective at bringing in brand-new visitors, who we’re able to accurately distinguish from returning visitors because of our reliable first-party data foundation.
Note: This view has been deprecated in favor of Clickstream, read more about the New Visitor data available here.
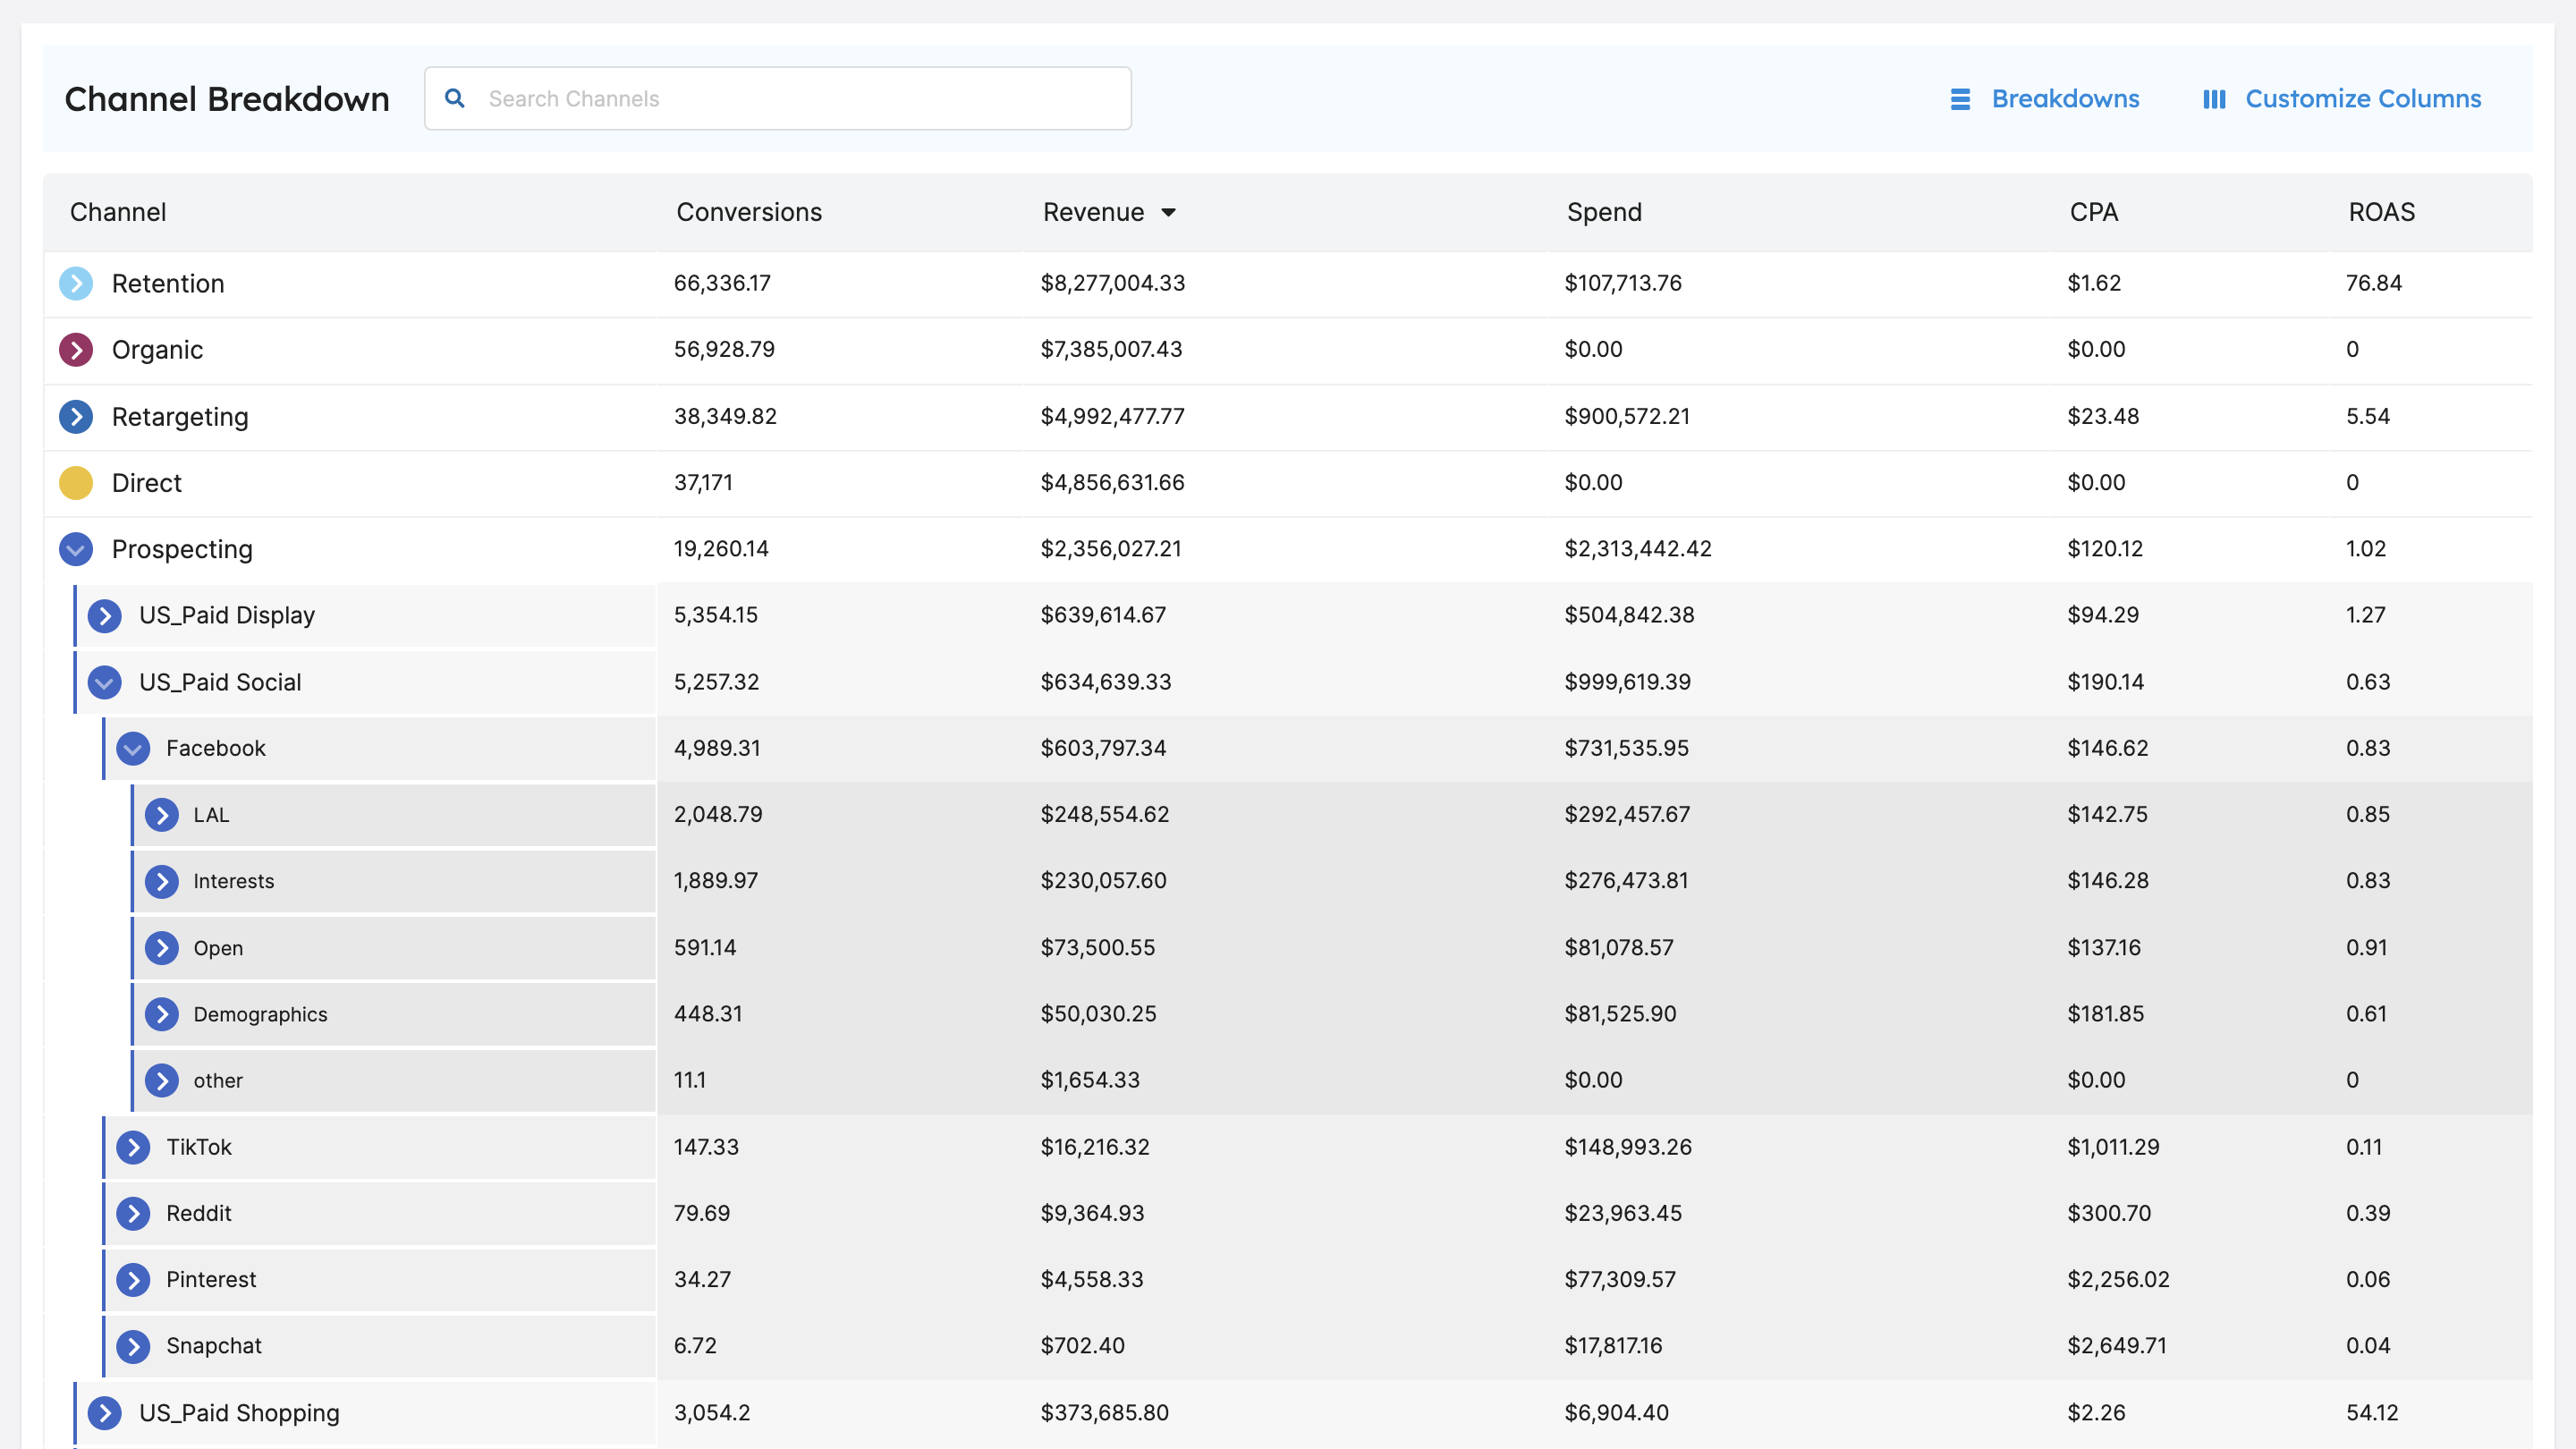
Get a Cross-Channel View of Marketing Performance
One of the key benefits of using Rockerbox is the ability to see the impact of all your marketing in one place. The best place to do that in our revamped UI is the Attribution Report.
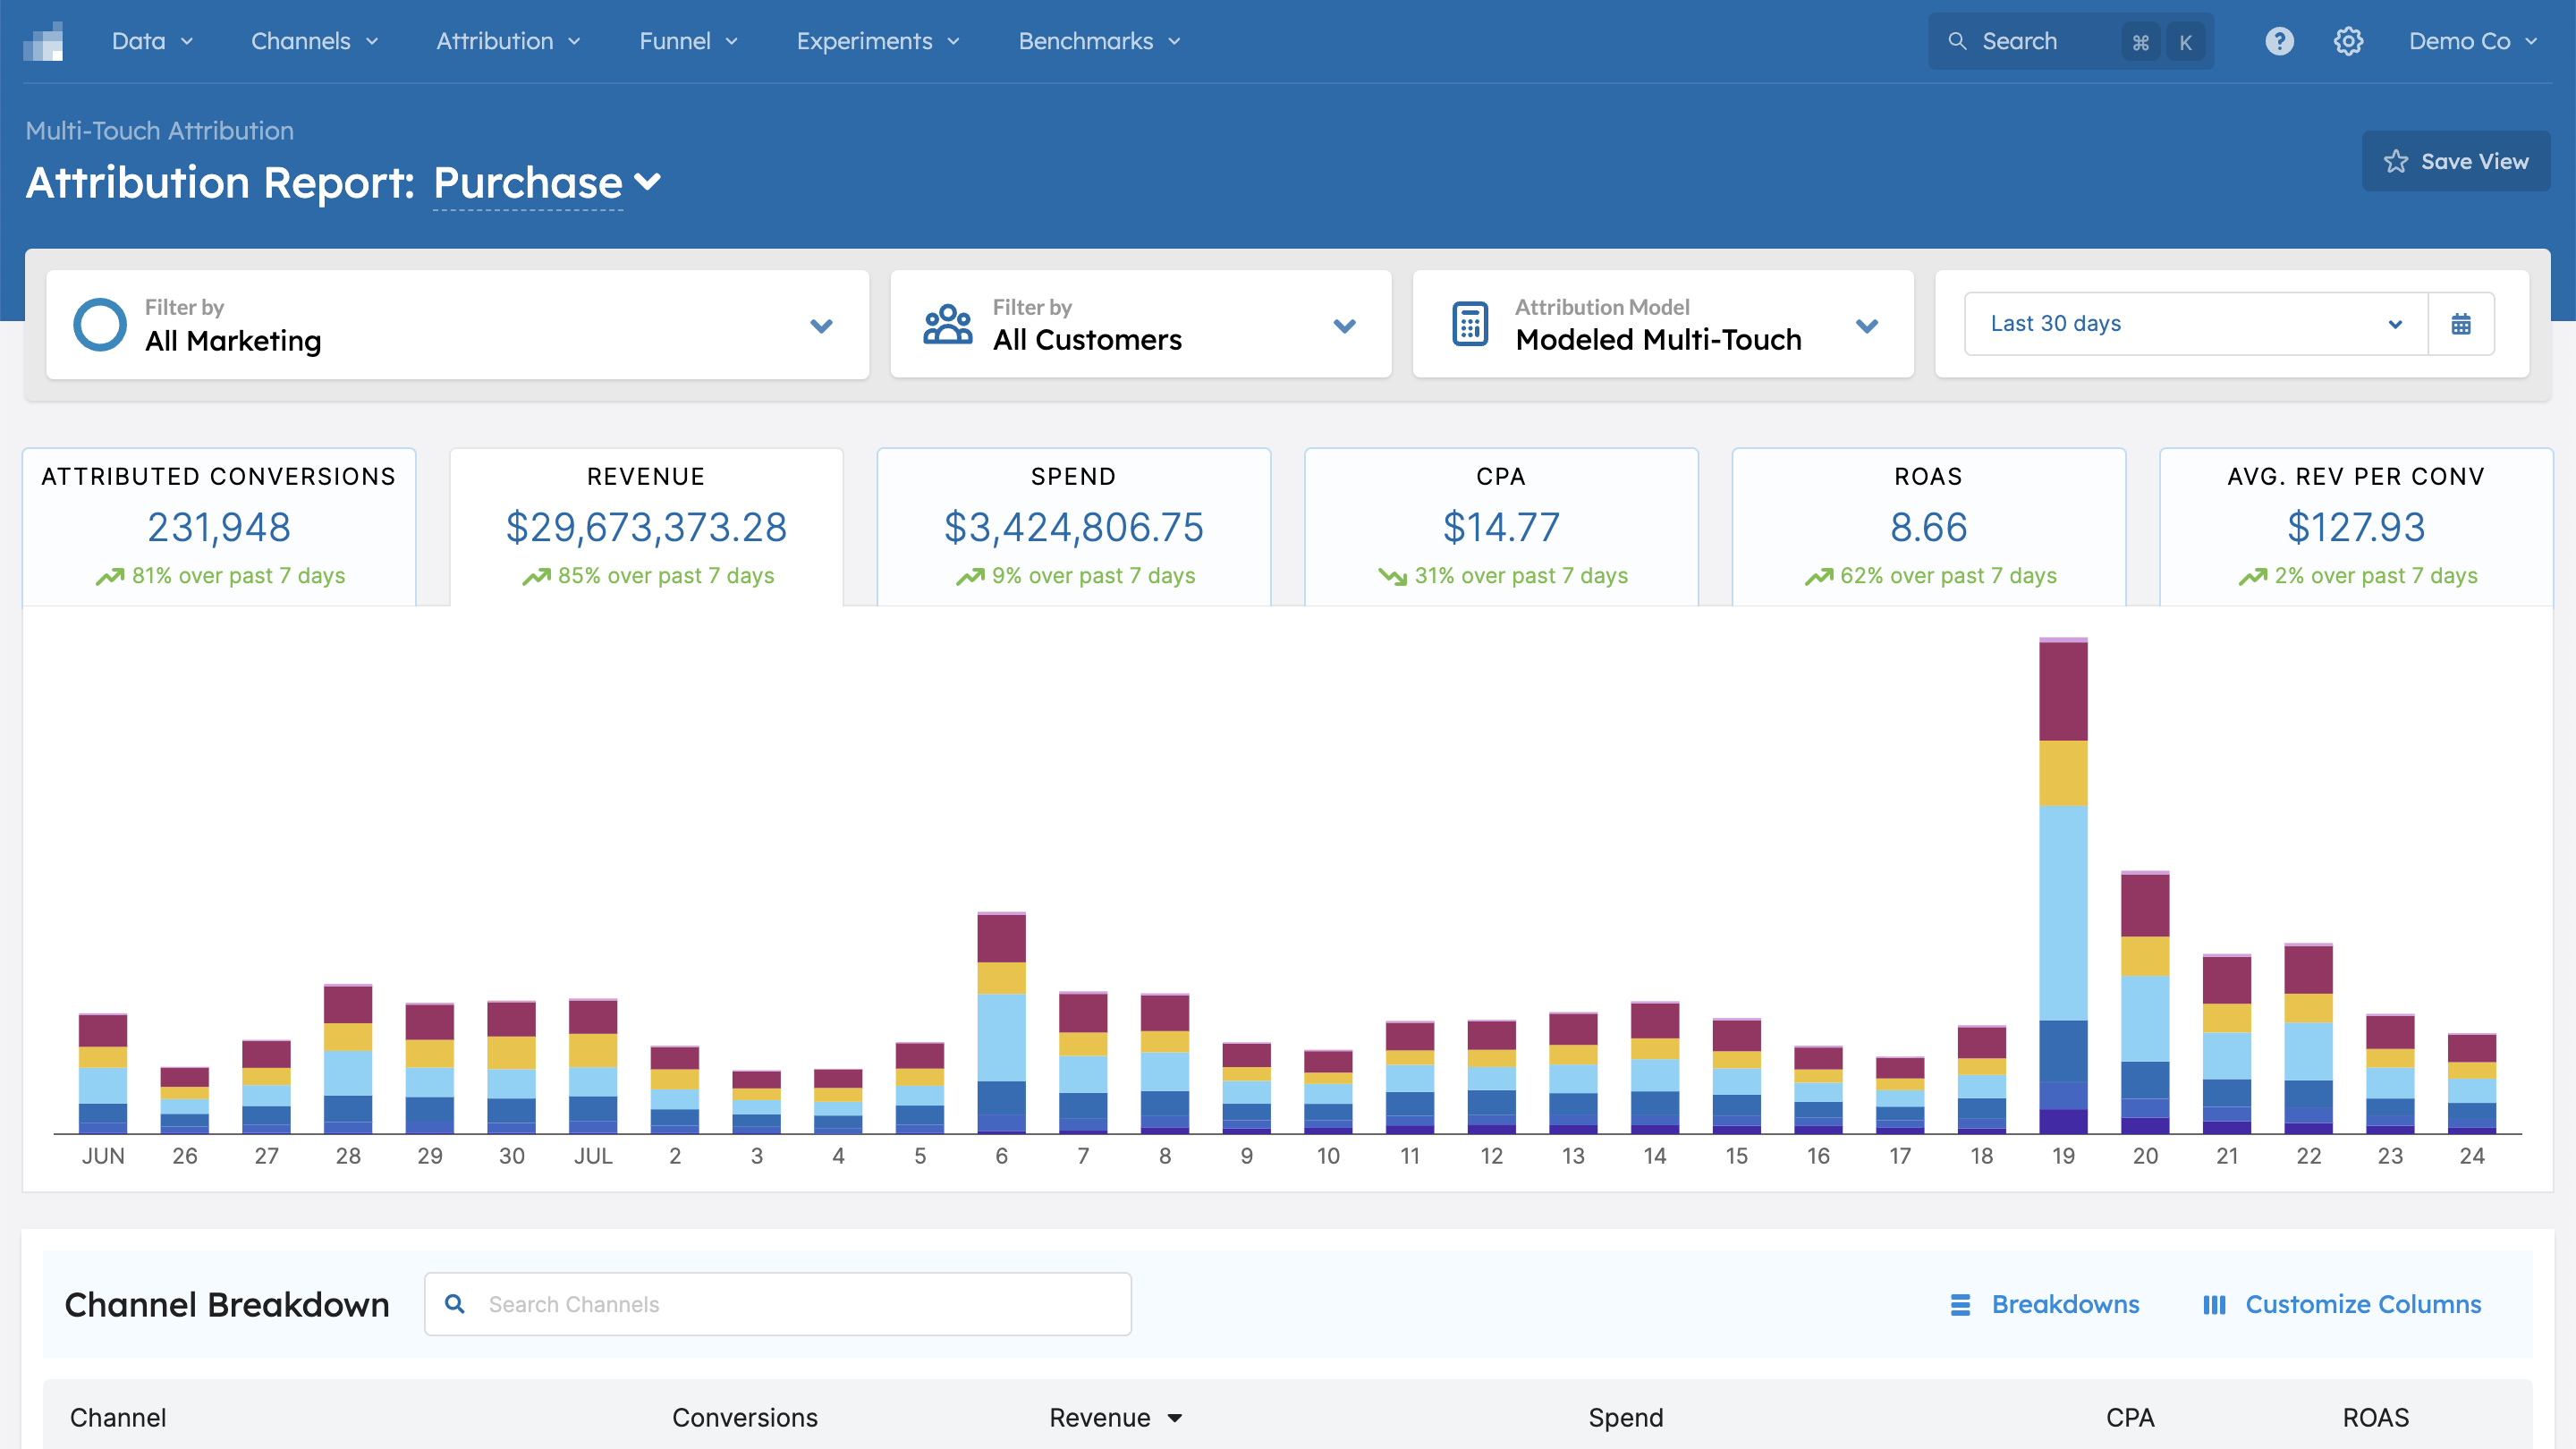
Within this report, you can see which marketing channels are most effective at driving purchases or other actions. This report lets you customize what you see by toggling between attribution models and filtering by customer attributes.
A Transparent View of Identity Resolution
Your customers access your site across multiple different devices and browsers, but Rockerbox’s identity resolution capabilities allow us to link these disparate events into one cohesive picture of a customer’s activity. In the Order Detail view, accessible through the Orders & Conversions page, you can get both granular order and customer information and also see a graph of how Rockerbox resolves identity across multiple devices and browsers for individual users.
-png.png)
Compare Your Spend to Industry Averages
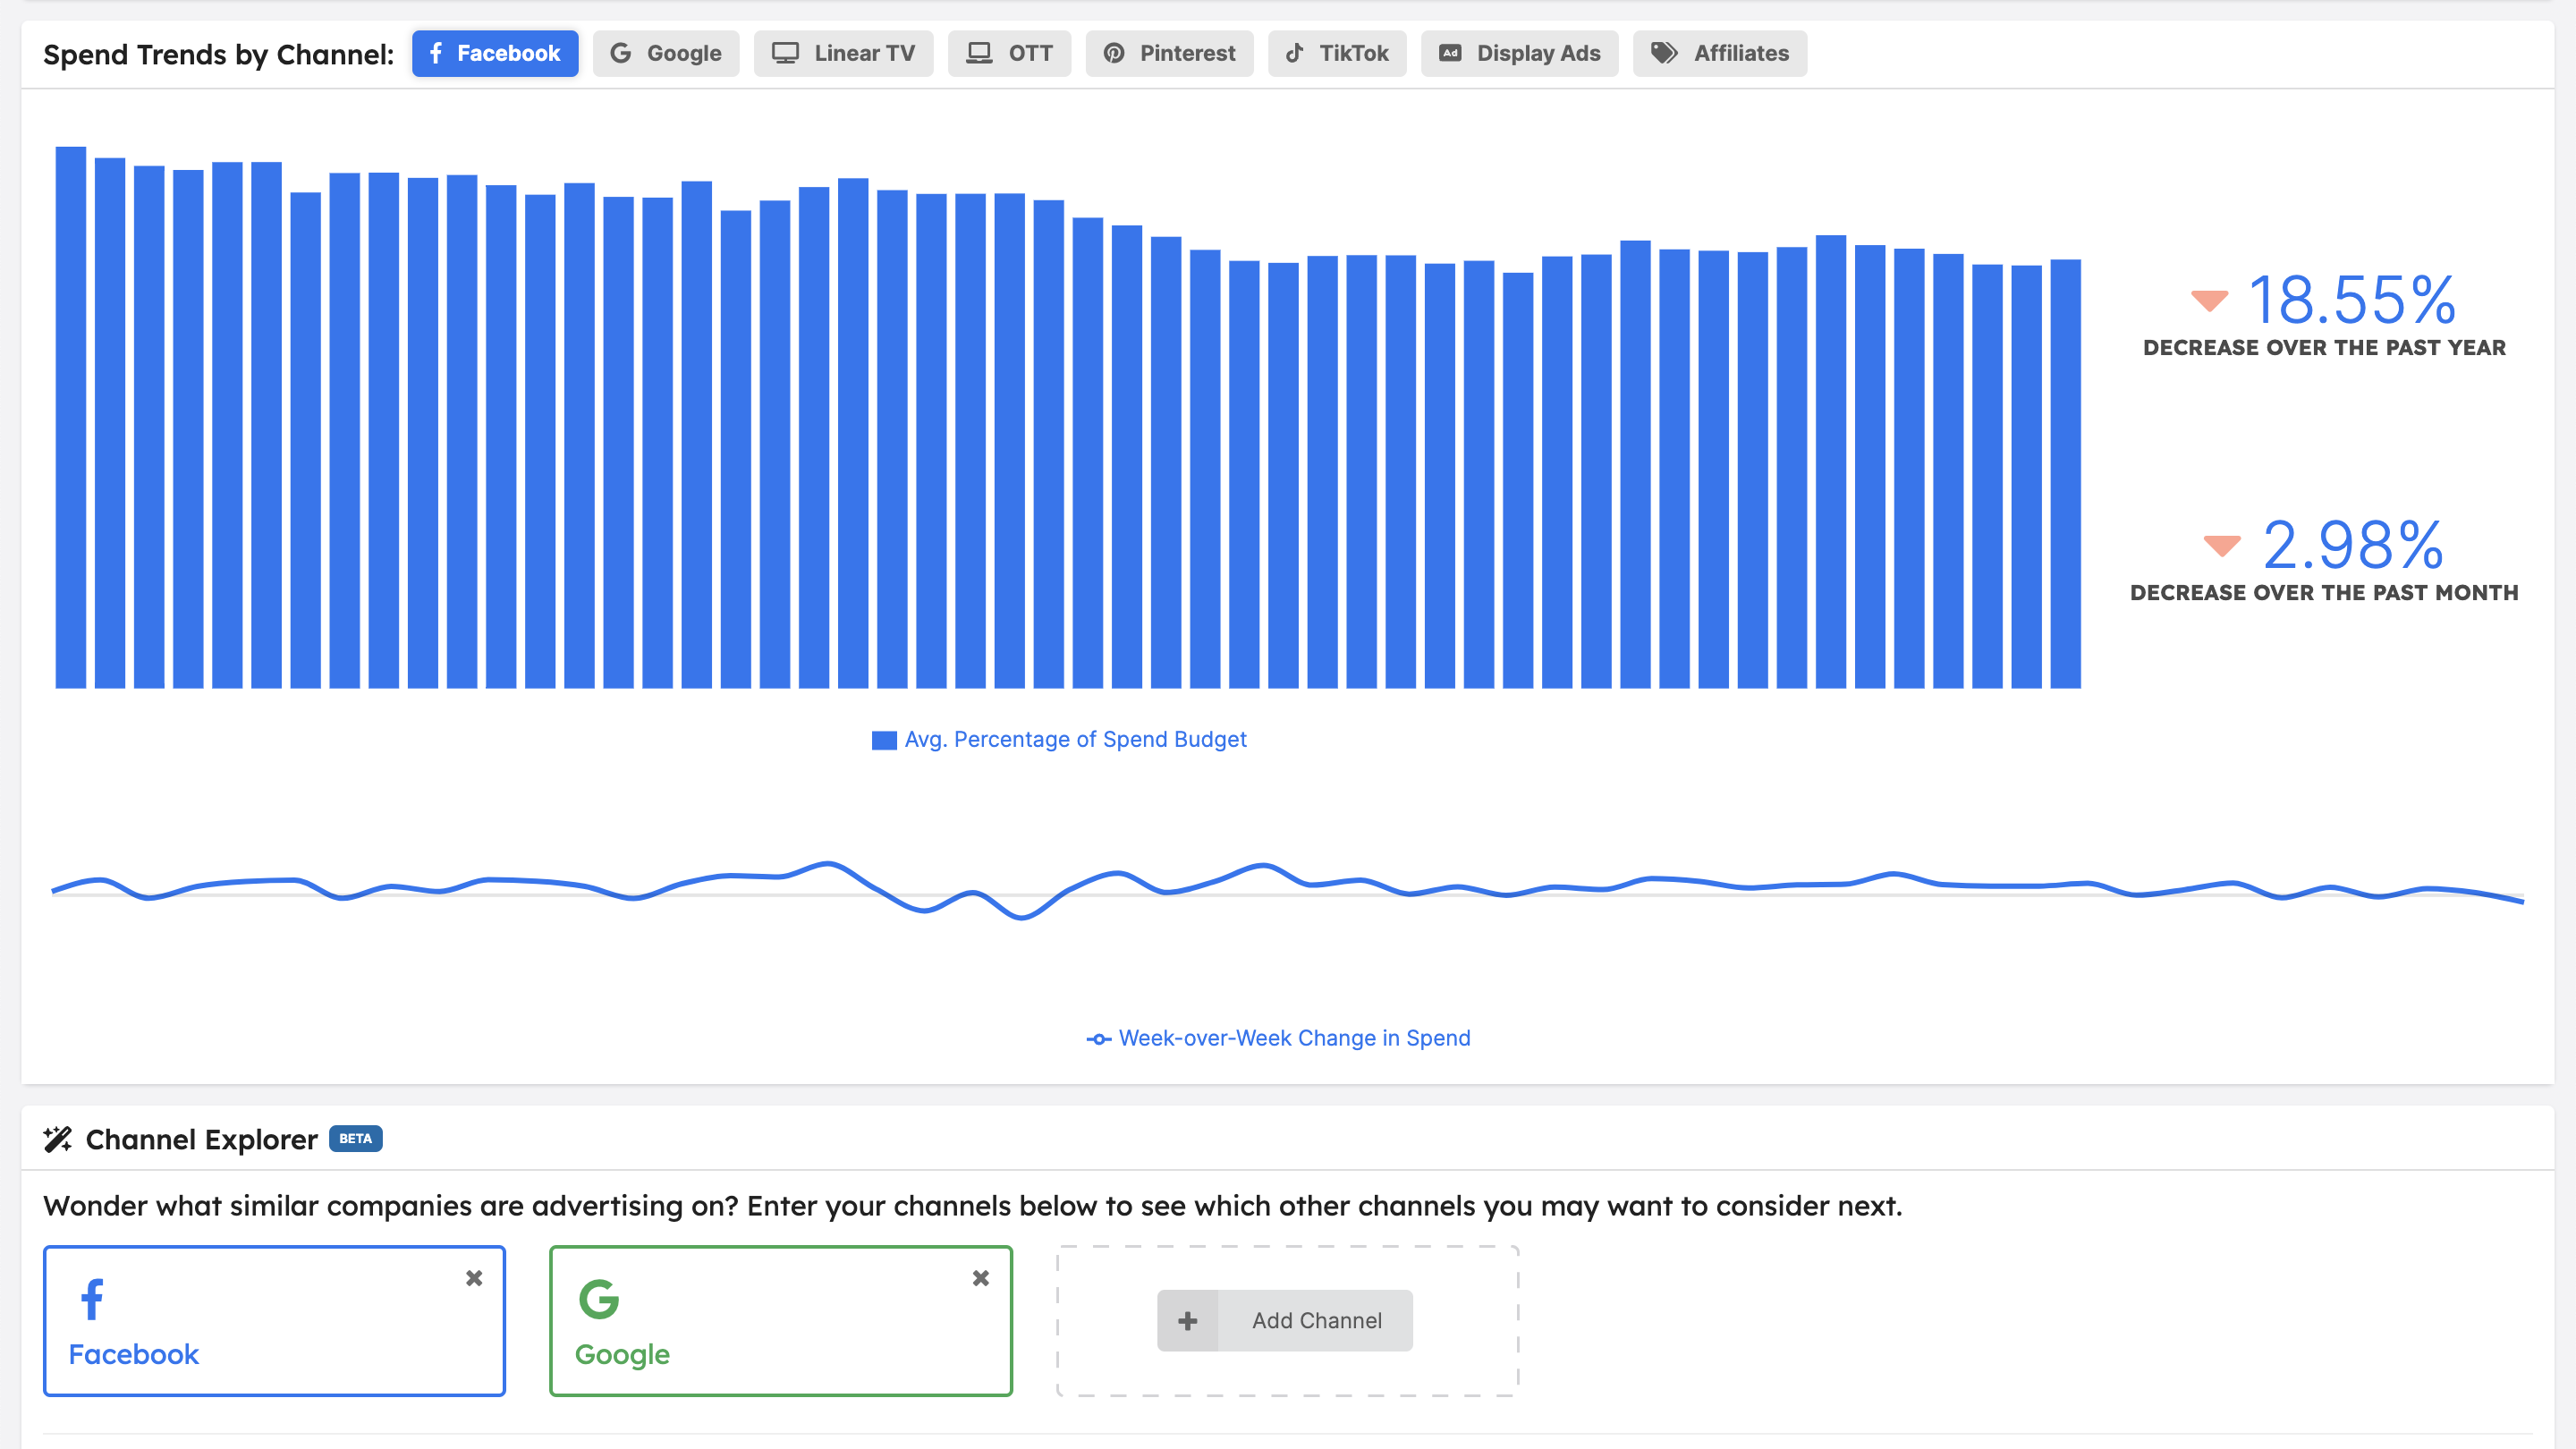
Ad spend is often fluctuating in the digital-first business space as companies explore emerging ad platforms and as platforms themselves evolve (in both positive and negative ways). Rockerbox has many views that can give you insights into your own spend and performance, but we’ve just added a way to see how other companies like you are directing their spend.
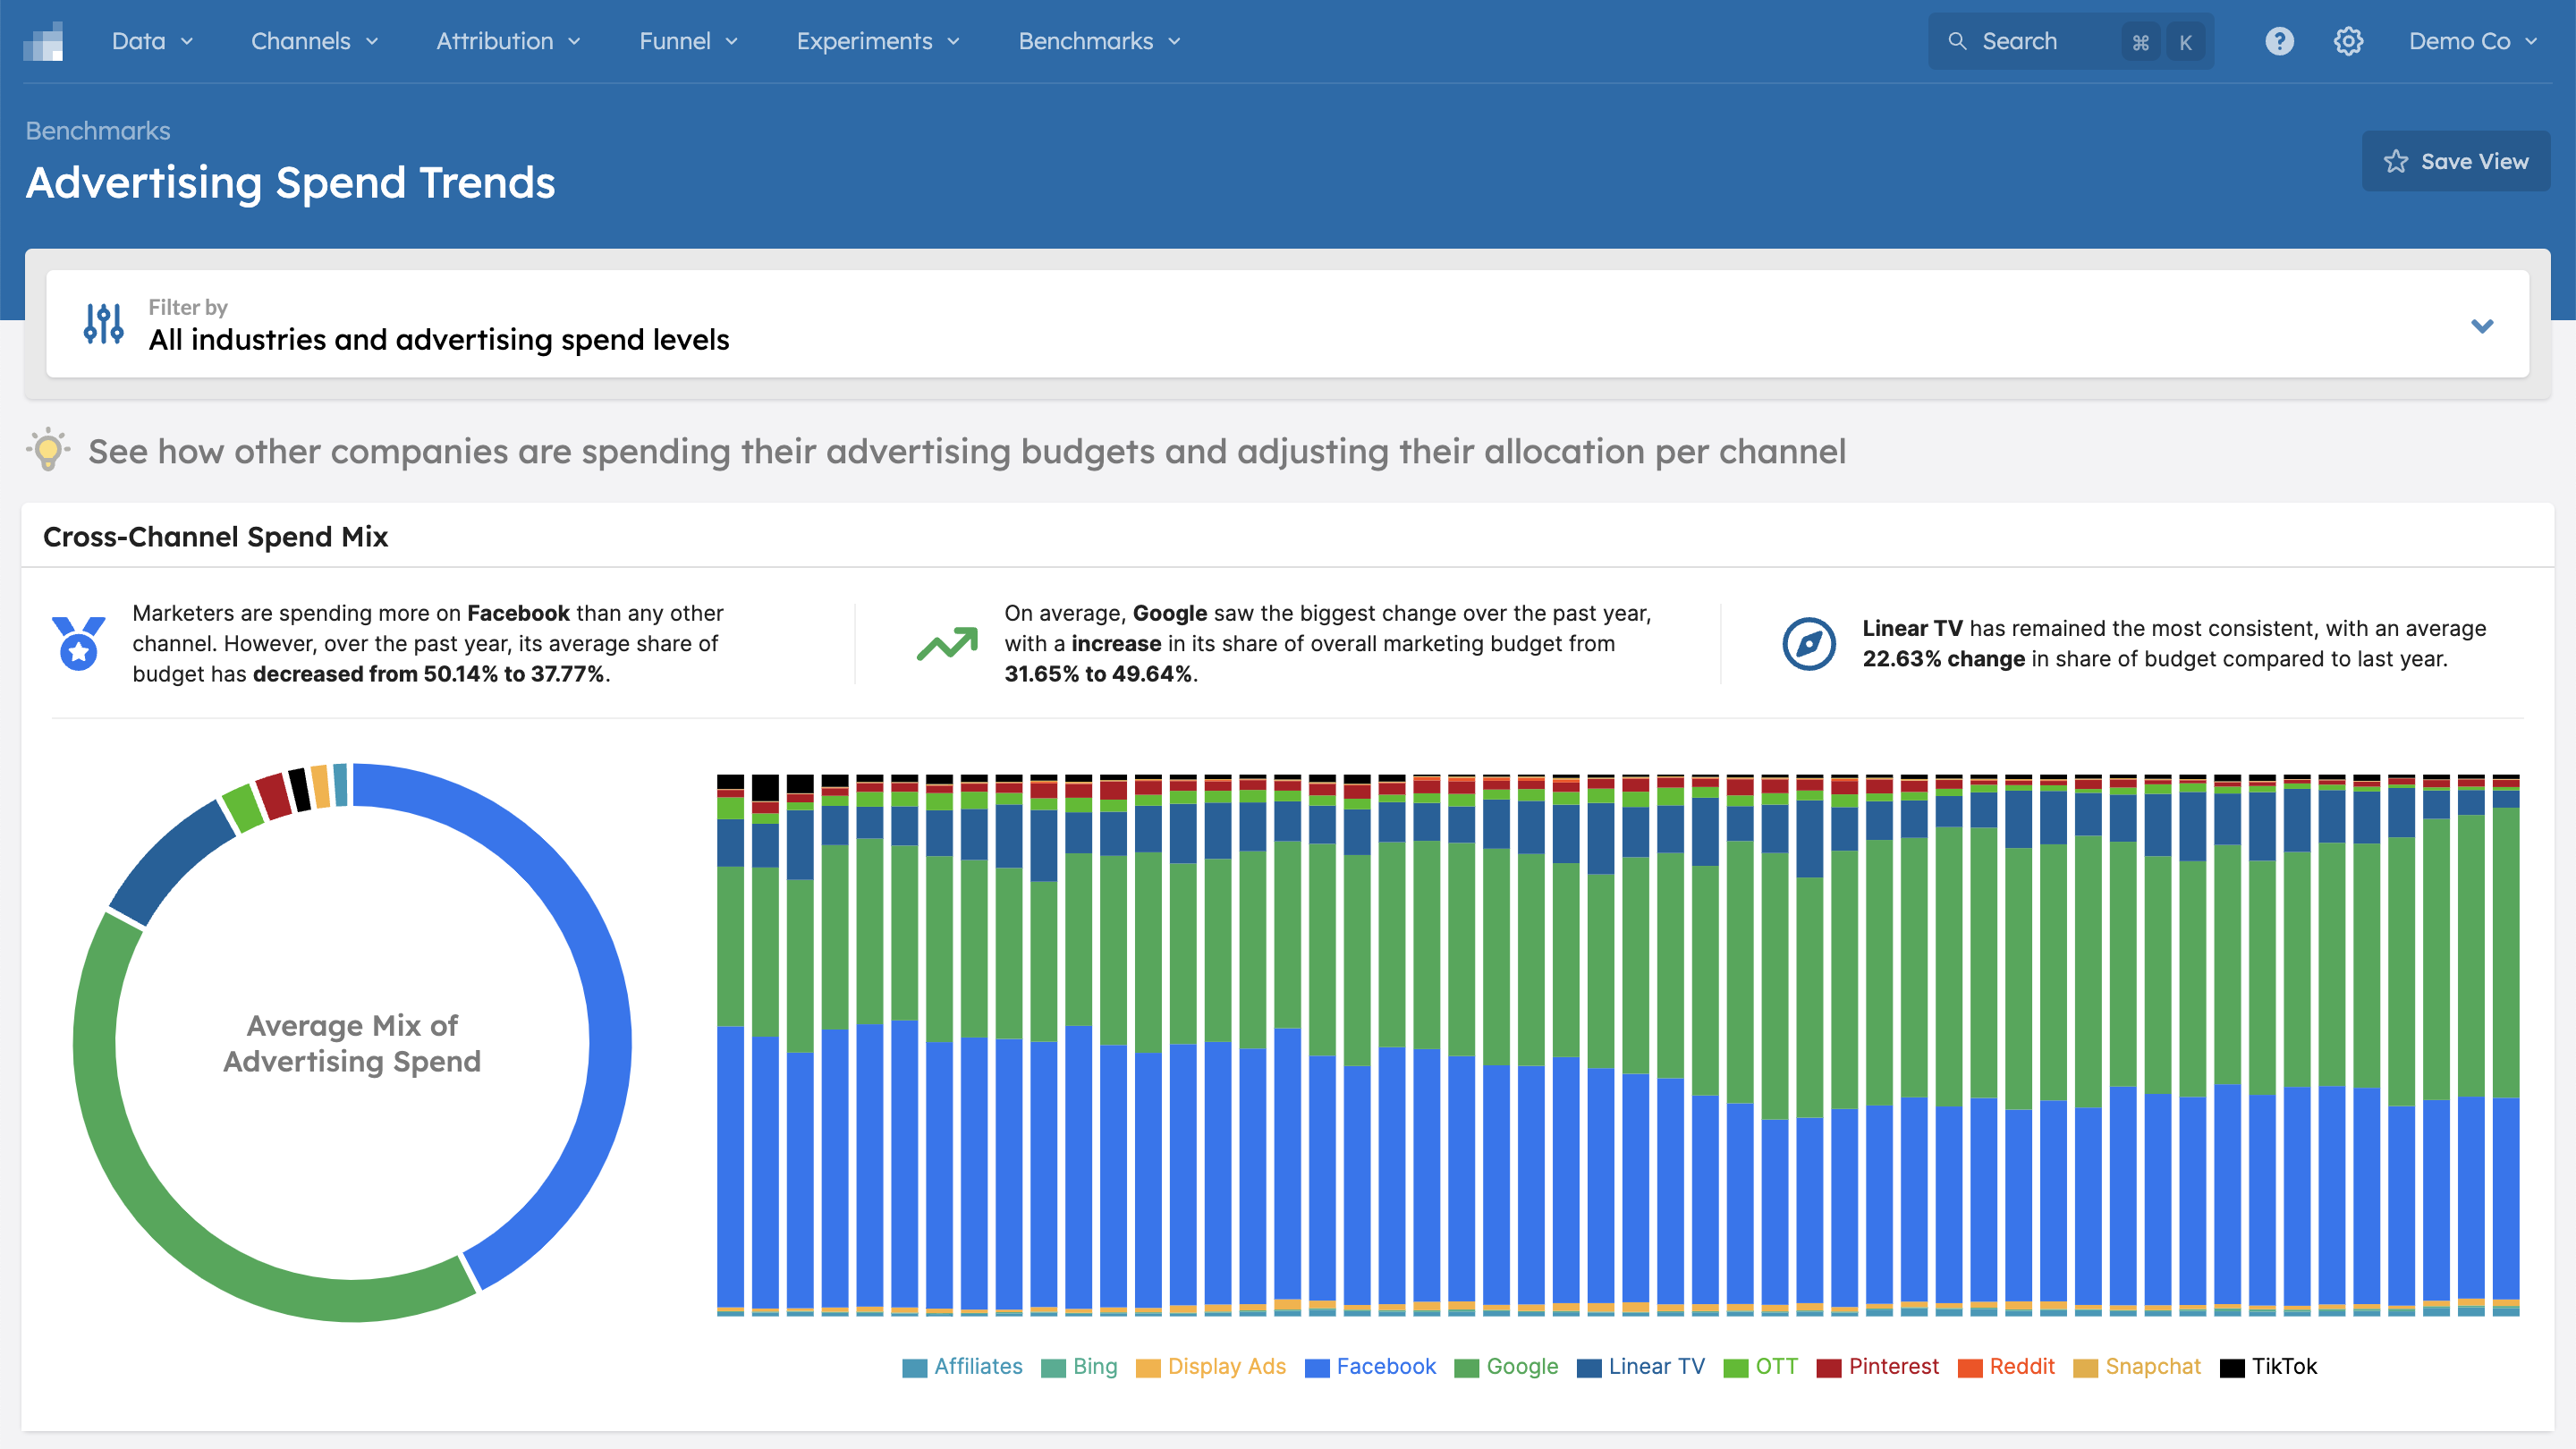
Our benchmarks view shows you how companies across multiple sizes and industries are varying their channel spend over time, with both whole budget and per channel views.
Explore the Platform that Unlocks a Full Picture of Your Marketing
Want to explore any of these benefits in more depth? We’re on standby to give you a personalized demo of how our platform could help you become a more data-driven marketer.

 Google
 Facebook
 Instagram
 TikTok
 Snapchat
 Reddit
 Pinterest

.png?width=50&height=56&name=medal%20(1).png)


.png?width=685&name=New%20Website%20Blog%20Headers%20(7).png)


%20(30).png?width=435&height=200&name=Blog%20Headers%20-%20New%20(1200%20%C3%97%20800%20px)%20(30).png)
