For years, Rockerbox has been the leading marketing attribution and measurement platform for marketers that need a full view of their marketing impact, plus attribution that’s based on first-party data. Now with our latest UI upgrade, Rockerbox is even more powerful, with greater ease of use and a sleek new look.
Explore the release below, then see the changes yourself in a 1-1 demo with our team or in your own account if you’re already a Rockerbox customer.

Rockerbox Reimagined User Interface
As the single source of truth for marketers, Rockerbox has previously featured various views that showed information about their marketing mix, customers and their paths to purchase, experiments, and more. The revamped UI includes all the former functionality of Rockerbox plus new and improved views to deliver even more marketing insights.
We’re confident these updates are just what DTC marketers need, because we’re guided by feedback from our very own customer base, including customers who have reached IPO-level with Rockerbox as their marketing attribution tool.
New Views
Home Page
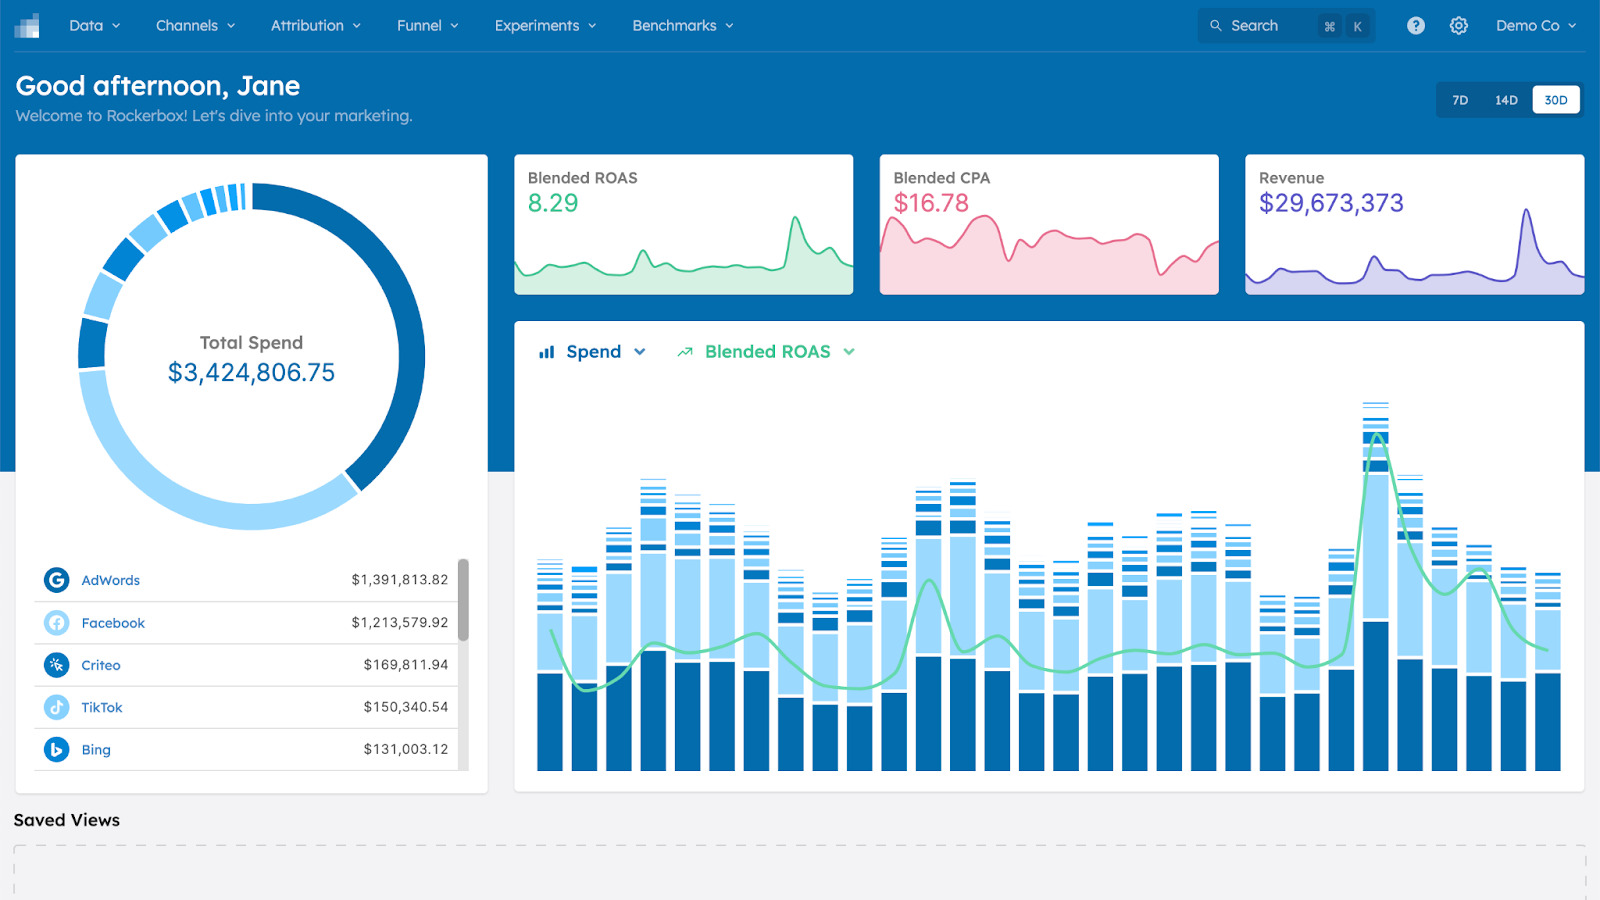
When you first log in to Rockerbox, you’ll now be greeted with an account overview showing important metrics, such as:
- Blended ROAS & CPA across all marketing channels
- Revenue
- Spend per channel
From the Home Page, you can see a quick snapshot and recent trends of your marketing KPIs in one dashboard.
Have additional metrics or reports you regularly want to review? Rockerbox now has Saved Views that you can create throughout the platform. Build a collection for yourself or share with your team.
Digital Ad Platforms View
Tracking and compiling digital advertising performance data is central to what we do at Rockerbox, and we’re now providing three new views that give you key insights into the impact of the ads you’re running.
- Platform-Reported Performance — This view will show you performance directly from a digital ad platform itself. In-platform metrics can sometimes be slow and misleading, but Rockerbox makes it easier to understand with pre-built charts and granular insights on everything that you're running. Additionally, Rockerbox saves you time and energy by pulling all your channel reported data into one platform.

- Platform vs. Rockerbox Comparison — Platforms don’t always show the full picture, but Rockerbox’s metrics, based on first-party data, give a realistic view of your marketing that you can see alongside platform metrics to compare the two.

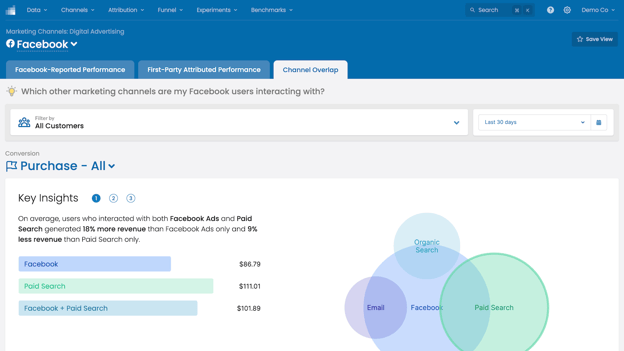
- Channel Overlap — Are your channels hitting the same audiences? The new Channel Overlap view helps you get the insights you need to make smart decisions about where to direct your ad spend by showing you where channel overlap is helping and hurting you. The channel overlap view essentially tells you how channels compliment and work with each other, plus the actual revenue changes when multiple channels are leveraged vs. one
Spend Benchmarks
Rockerbox is in the position to aggregate a range of useful marketing spend insights from some of the top names in DTC, and now we’re sharing those insights with Rockerbox customers in our new “Spend Trends” view.
This view, sortable by ad spend tiers and industry, displays an average advertising mix over time, spend trends by each individual channel, plus select highlighted insights. 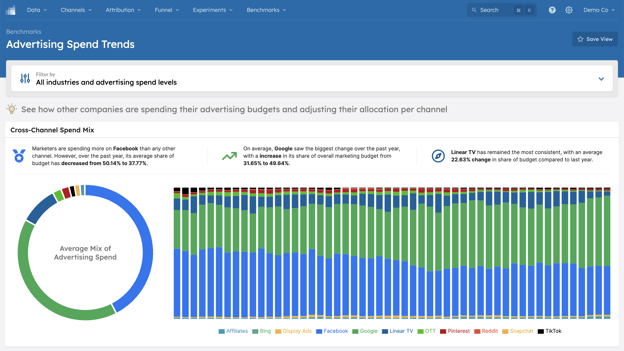
Interested in getting immediate access to these trends? Sign up for a free account to shortcut to the insights.

Redesigned Views
In addition to the brand new Rockerbox views, we’ve redesigned several existing views to make it easier to access the insights you need to run your marketing.
Attribution Report

The attribution view allows users to see the true impact of all their marketing channels. On this view, users can toggle between attribution models to compare and view different results from first-touch, last-touch, and multi-touch attribution and see conversion, revenue, spend, CPA, and ROAS by channel.
This view not only gives you a full view of marketing attribution for all your channels, but also highlights key changes over time to help you understand the trajectory of your marketing.
Marketing Paths
-png.png?width=624&name=marketing-paths-1%20(1)-png.png)
Rockerbox lets users understand the journey their customers take from initial contact with their brand to purchase, and the Marketing Paths view shows these journeys in detail, including highlighting fastest paths, highest earning paths, and more.
Orders & Conversions
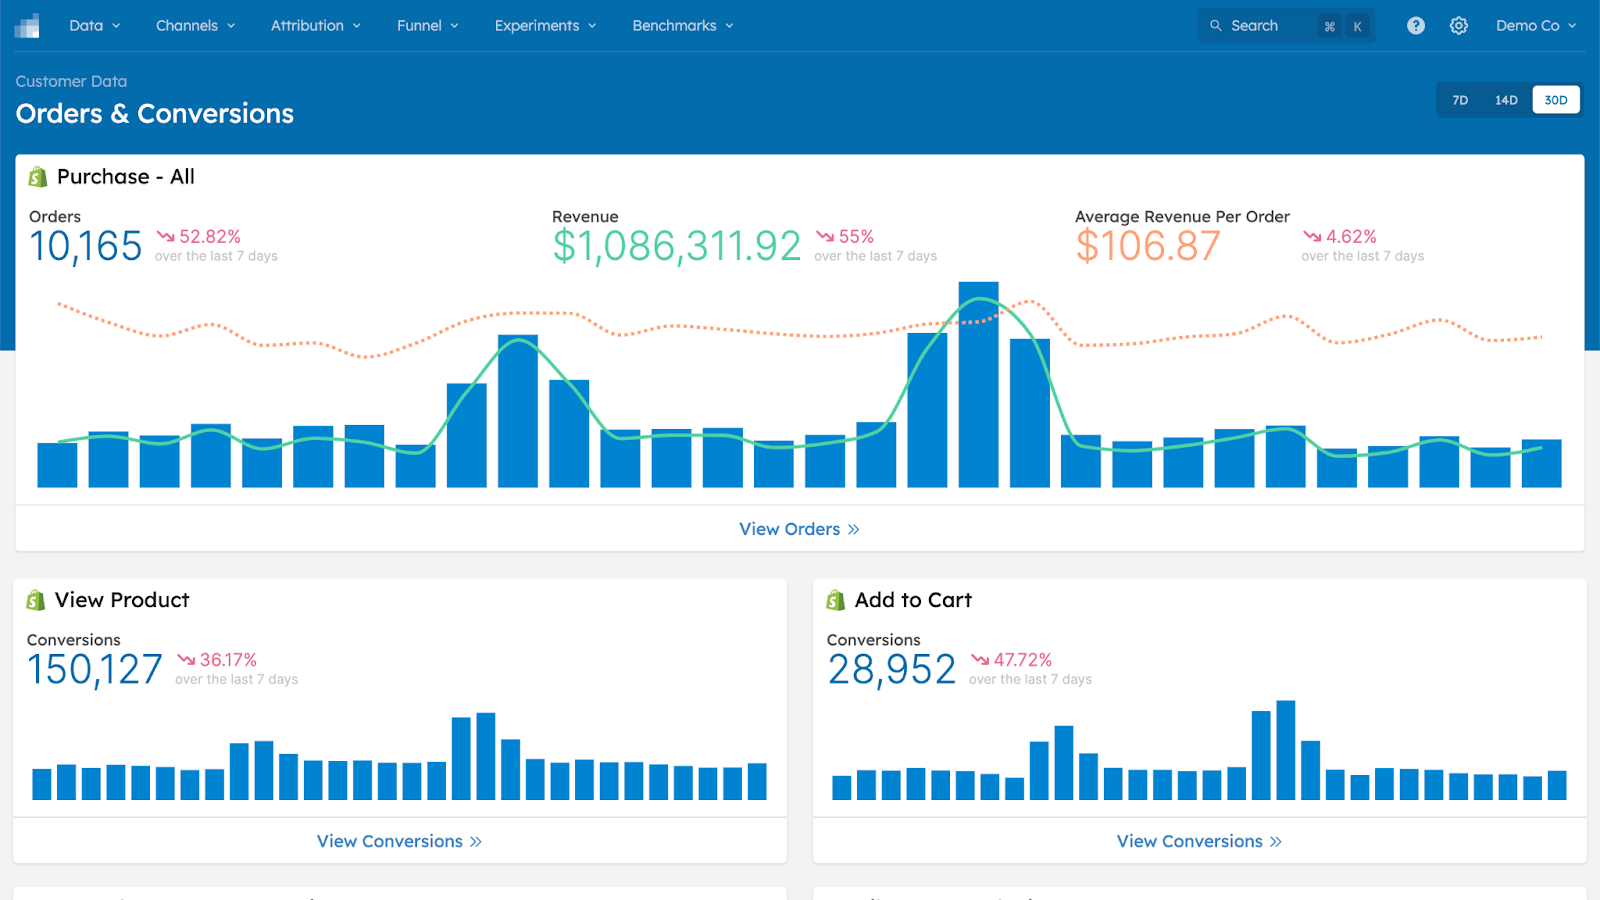
The orders and conversions view shows you all purchases and conversions on platforms you’ve connected to Rockerbox, including Shopify and elsewhere. One of the most exciting parts of the redesigned view is the ability to look at individual customer records and see granular details about their purchases and marketing touchpoints.
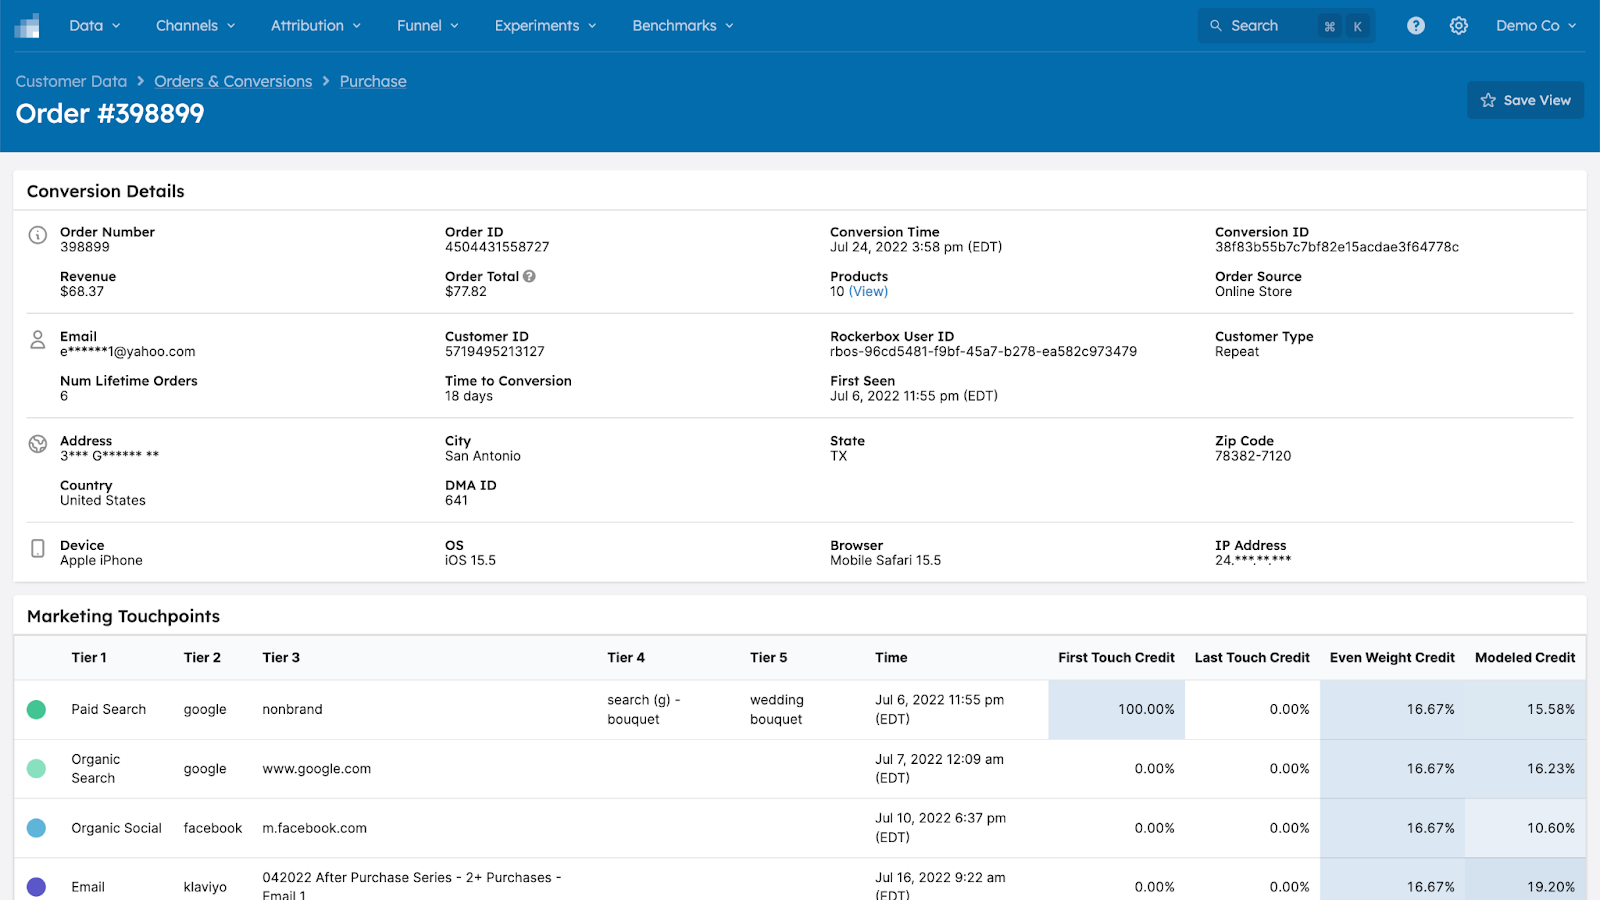
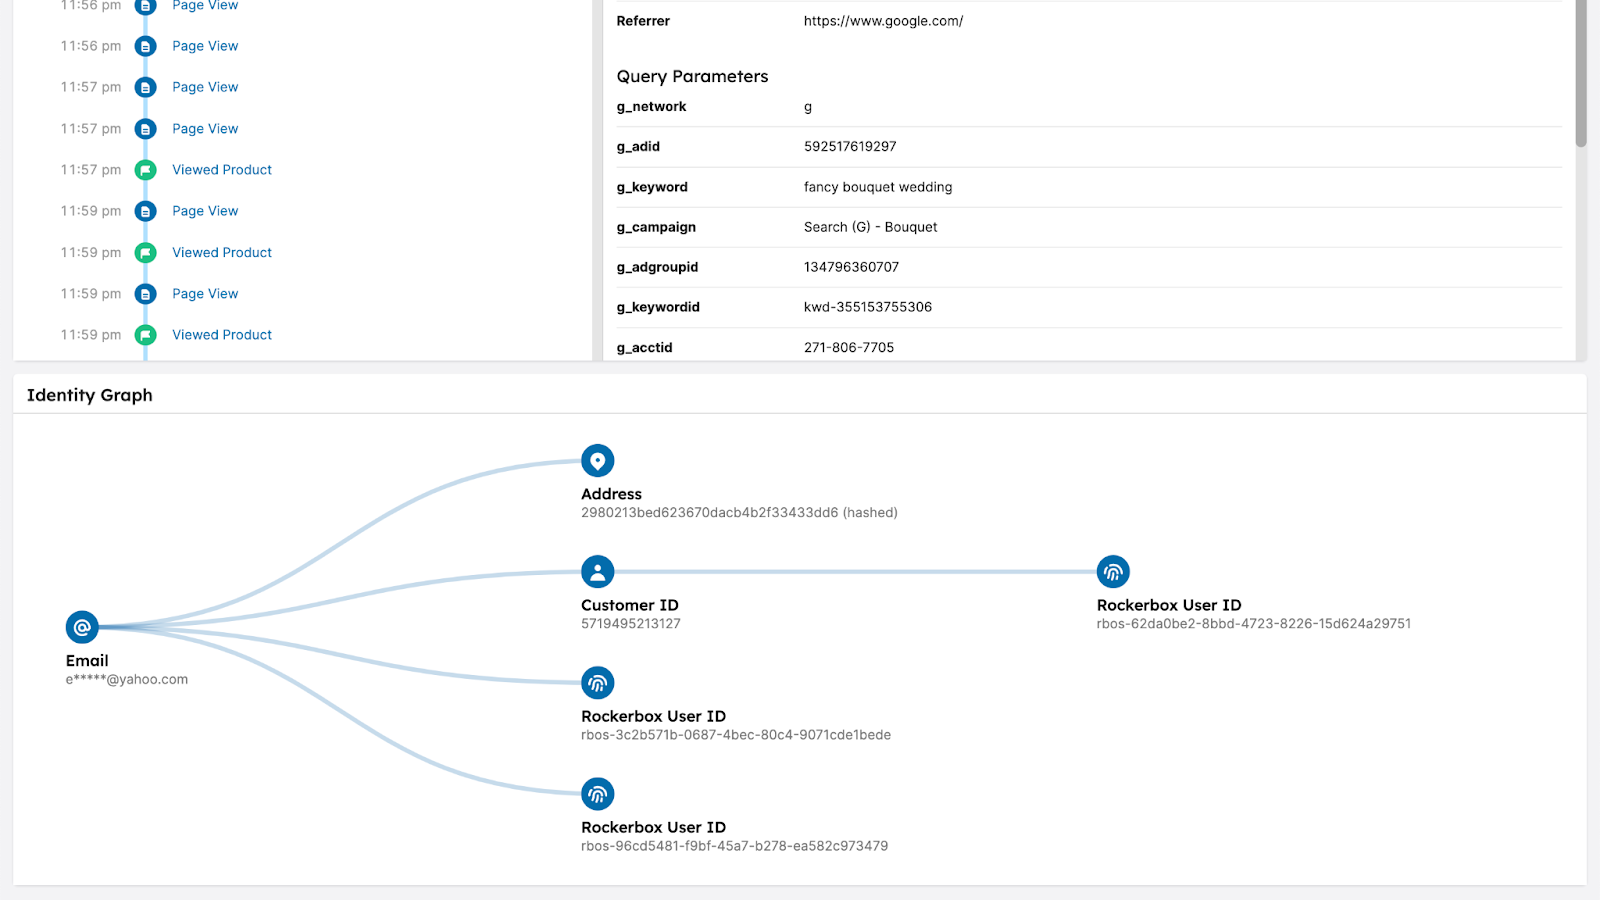
Individual records also give you visibility into how Rockerbox is able to resolve customer identity across multiple disparate touchpoints and interactions.
More Features
In addition to these changes to the Rockerbox UI, we’ve also released:
- The ability to search Rockerbox
- The ability to save specific views
Ready to see it live?
Schedule a 1-1 demo with our team to learn more about how Rockerbox could help you become a smarter, more effective marketer.

 Google
 Facebook
 Instagram
 TikTok
 Snapchat
 Reddit
 Pinterest


.png?width=50&height=56&name=medal%20(1).png)